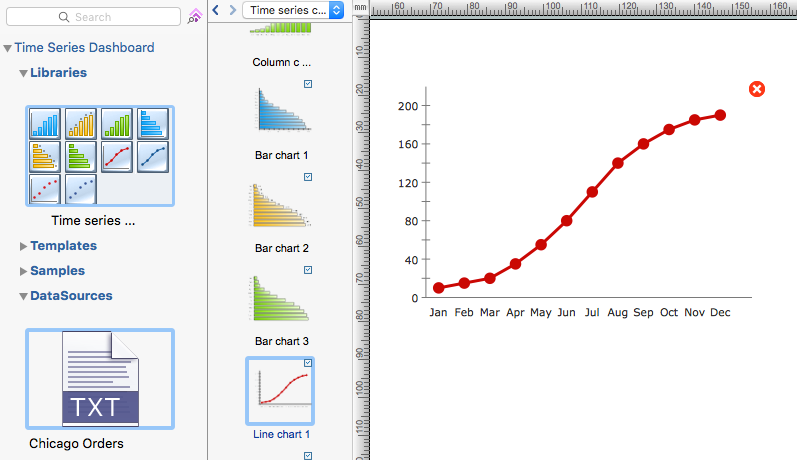
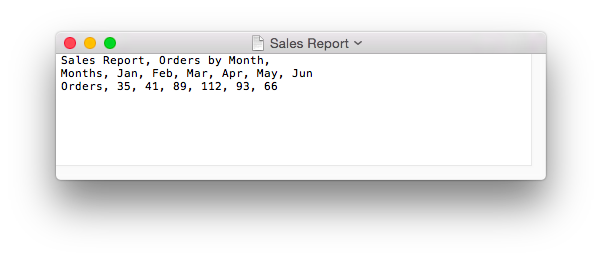
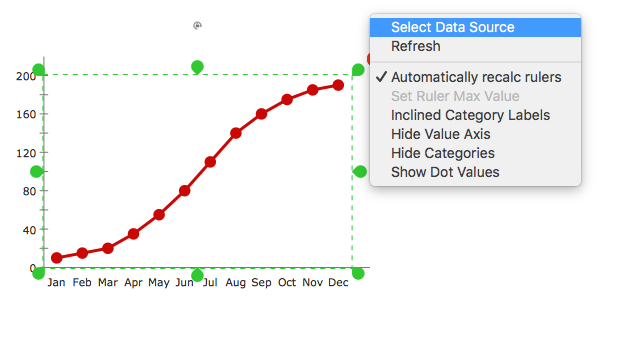
How to Create a Time Series DashboardThe “Dashboards” area of the ConceptDraw Solutions is a collection of basic types of Visual Dashboards. The Time Series Dashboard solution can be used to create the interactive Time Series Charts as Column Charts, Line Charts, or Bar Charts for your interactive dashboard. You can easily create a visual interactive dashboard using charts and graphics indicators from Live Objects libraries. Then you can connect the Live Objects with data source files to visualize the actual values of your performance metrics. For example, let‘s create an interactive chart to monitor visually the sales performance.


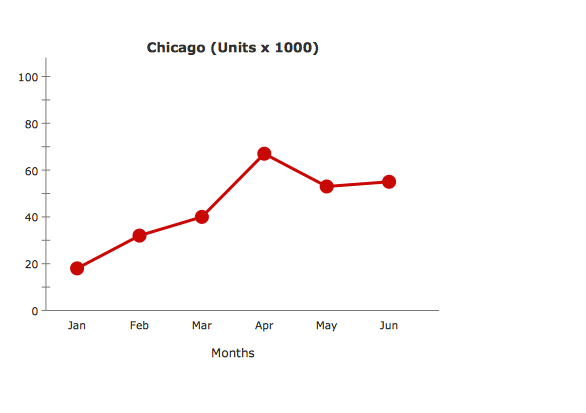
Result: Now your chart shows the actual data from the data source files. The Live Objects will refresh the data every 5 seconds. So as the data updates in the data source files, the Live Object shows the new data every 5 seconds. |
How it works:
Useful Solutions and Products:
|
 Visual Dashboards