How to Connect a Live Object to a Text Data Source
The “Dashboards” area of the ConceptDraw Solutions collects basic types of Visual Dashboards. Here you can find common types of charts and indicators combined into typical Visual Dashboards. In ConceptDraw DIAGRAM you can easily create a visual dashboard using charts and graphics indicators from Live Objects libraries. Then you can connect the Live Objects with data source files to visualize the actual values of your performance metrics. Live Objects of different types can use data source files of different formats: TXT, CSV, or XLSX. This article explains how to connect a ConceptDraw live object with data source files in TXT format to visualize the actual values of your performance metrics.
- Run ConceptDraw DIAGRAM.
- Activate the Solutions panel using
 button, and select a dashboard solution, for example, the Composition Dashboard. button, and select a dashboard solution, for example, the Composition Dashboard.
- Select a library.
- Add your first Live Object to the dashboard by dragging it from the library to the document page.
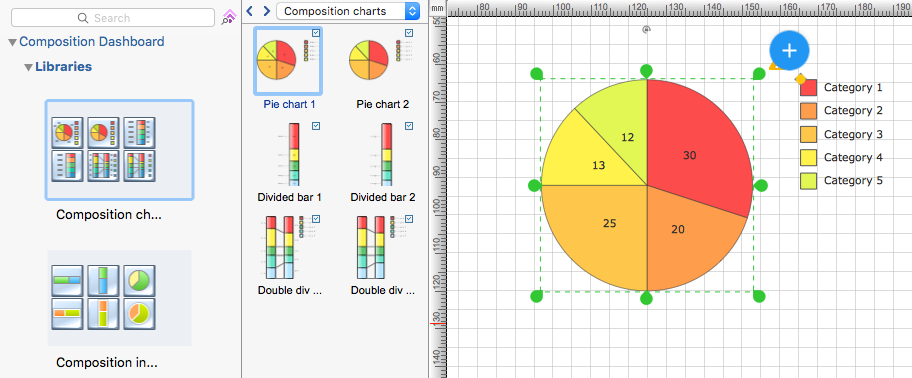
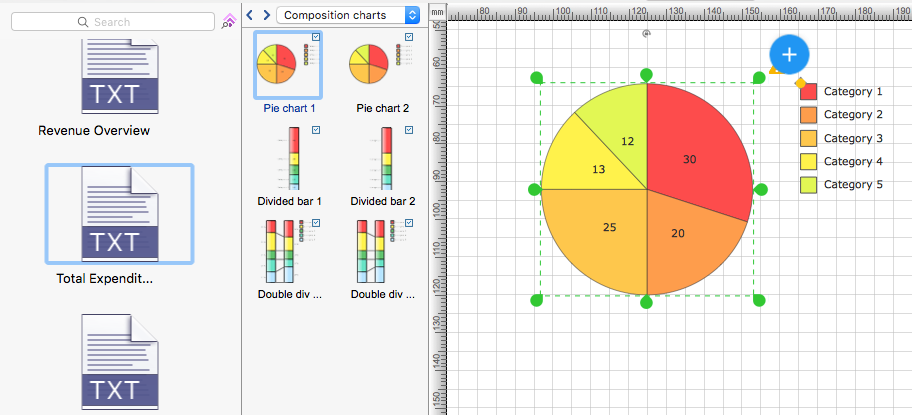
- To assign a data source to your Live Object, you can use a sample data source TXT file, or create your own.
- Open the new document window in any text editor, or click a sample data source file icon in the Solutions panel.
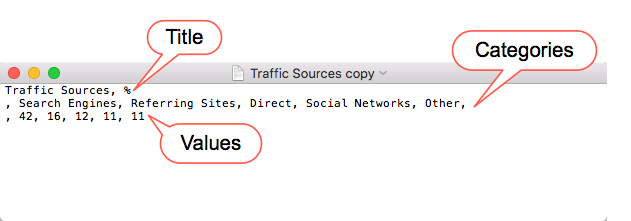
- Make the data source text file according to your particular data and save it in TXT format.
- Open Action menu of the selected Live Object, using the button
 in the upper right corner of the object, then choose Select Data Source and select your data source file. in the upper right corner of the object, then choose Select Data Source and select your data source file.
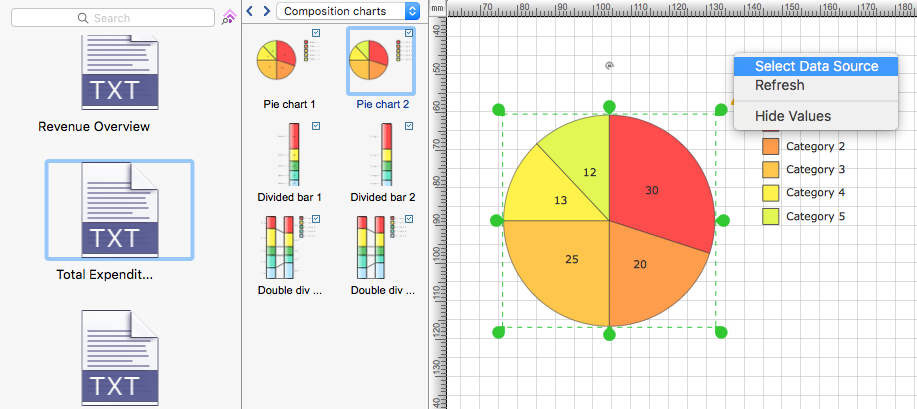
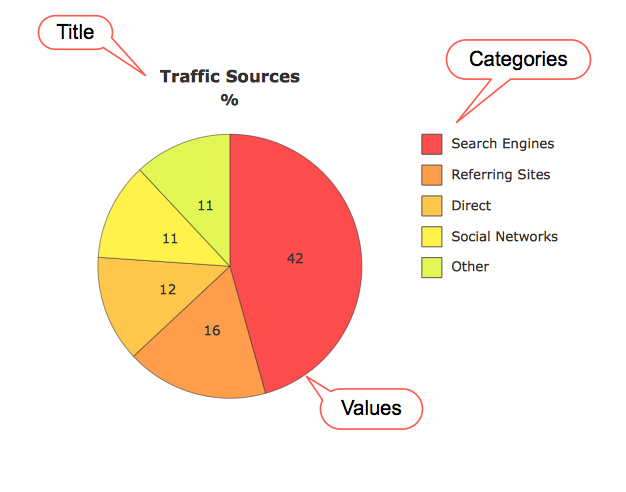
- The Live Object has changed its appearance because now it shows the actual data from your source file.
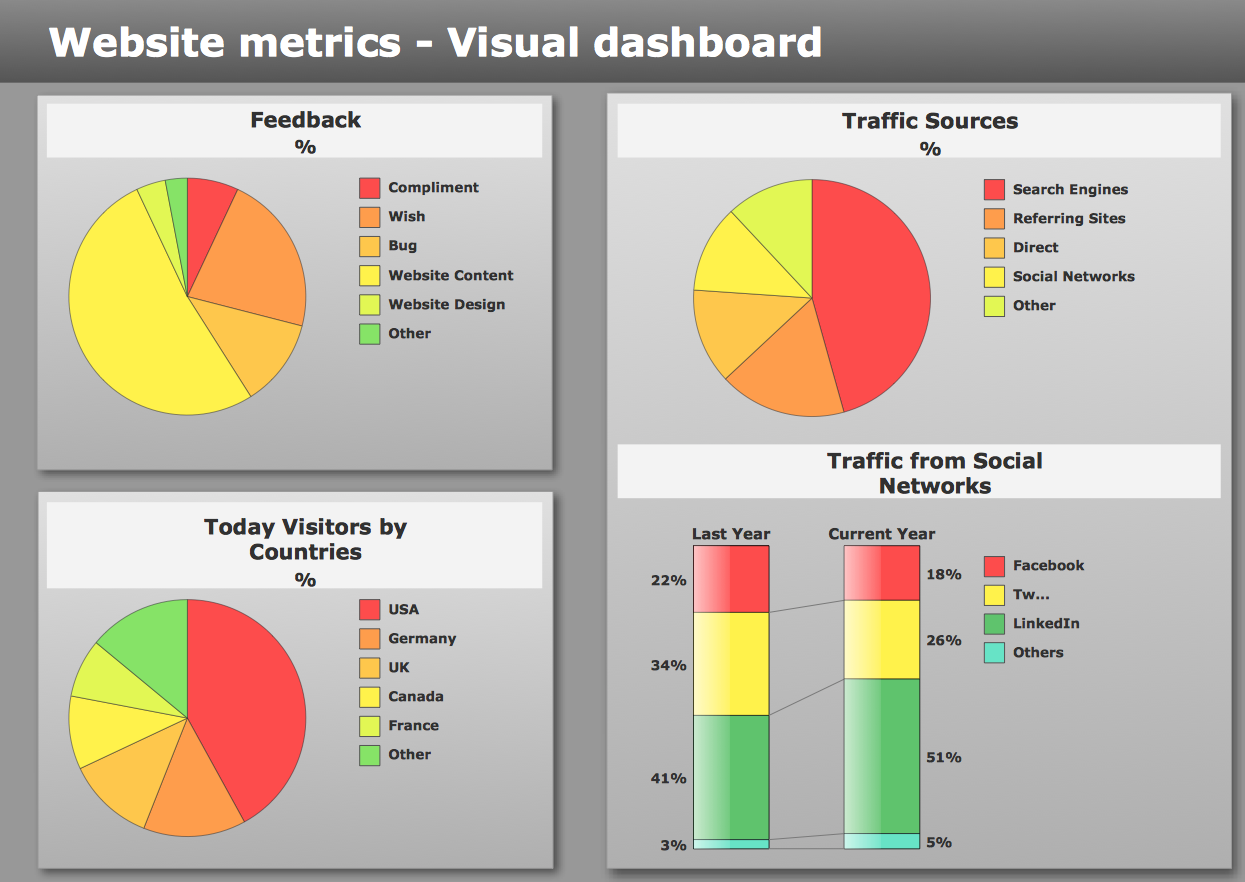
Result:Now your visual dashboard shows the actual data from your data source files. The Live Objects will refresh the data every 5 seconds. So as the data updates in one of the data source files, the corresponding Live Object on your dashboard shows the new data within the next 5 seconds.
|
How it works:
- Set of ready-to-use templates supplied with ConceptDraw DIAGRAM
- Collection of professional samples supports each template
- Professional drawing tools
- Live Objects Technology
Useful Solutions and Products:
- Visual dynamically updated dashboard.
- Interactive Time Series Charts: Column Charts, Line Charts and Bar Charts.
- Easily create graphic Quantitative Indicators
- Visualize the actual values of business KPIs
- Diagraming and Charts
- Vector Illustrations
- Maps
- Floor plans
- Engineering drawings
- Business dashboards
- Infographics
- Presentation
- Over 10 000 vector stencils
- Export to vector graphics files
- Export to Adobe Acrobat® PDF
- Export to MS PowerPoint®
- Export to MS Visio® VSDX, VDX
|


 Visual Dashboards
  button, and select a dashboard solution, for example, the Composition Dashboard.