How To Convert Data-Driven Infographics to Adobe PDF
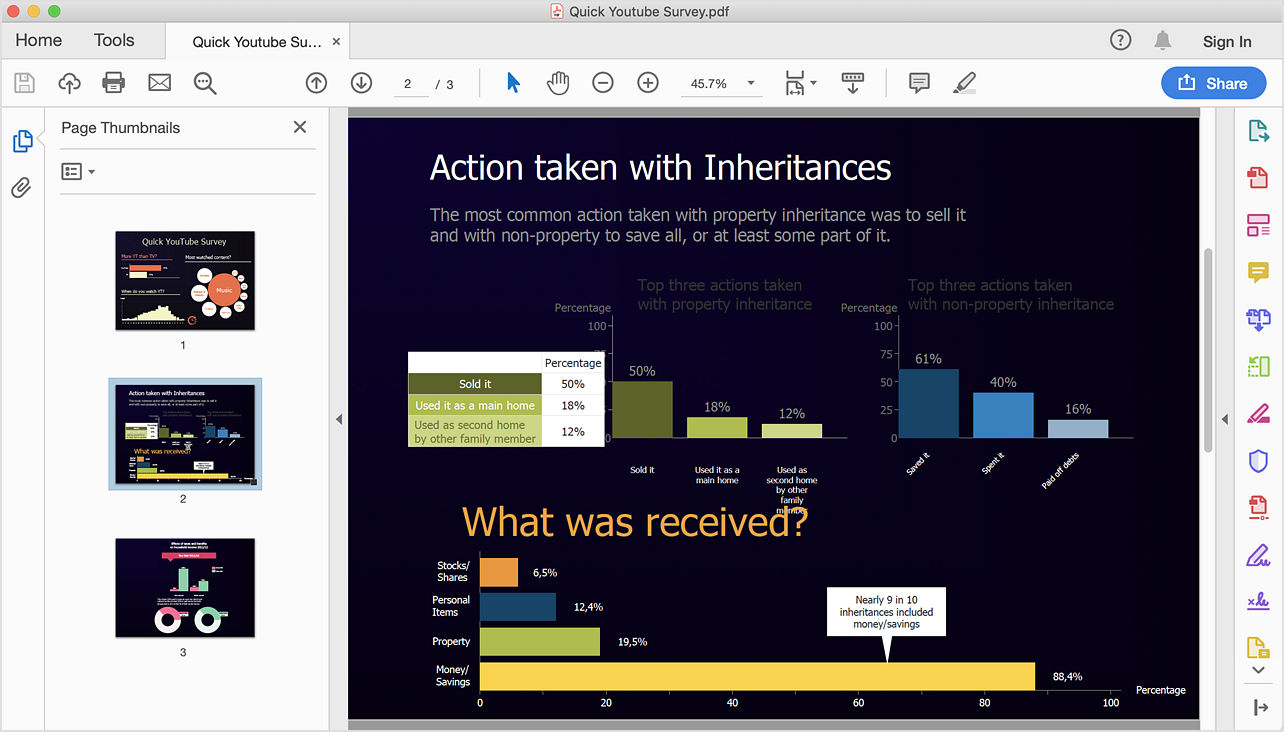
The Data-driven Infographics are often used to simplify the representation of large amounts of data and to monitor the data changes over time. Data-driven Infographics can contain bar graphs, pie charts, histograms, line charts and other elements that can be managed using ConceptDraw DIAGRAM ConceptDraw DIAGRAMhas export capabilities which allows you to export your infographics to Adobe PDF files. This allows you to easily share your graphic documentation between different computers with different operating systems and applications.
- Run ConceptDraw DIAGRAM.
- Open Data-driven Infographics, created with ConceptDraw DIAGRAM.

- You can add an additional pages to a document using the context menu of Page Navigator (menu View).
- Go to the File menu, click Export, and select Adobe Acrobat PDF.
- Choose a location to save your multi-page PDF file and click Save.
Result:
You can get clear business documentation pack and avoid any problems while communicating it with stakeholders.
|
How it works:
- Set of ready-to-use templates supplied with ConceptDraw DIAGRAM
- Collection of professional samples supports each template
Useful Solutions and Products:
- Block Diagrams
- Bubble Diagrams
- Circle-Spoke Diagrams
- Circular Arrows Diagrams
- Concept Maps
- Flowcharts
- Data Driven Charts
- Special templates
- Infographic examples
- Diagraming and Charts
- Vector Illustrations
- Maps
- Floor plans
- Engineering drawings
- Business dashboards
- Infographics
- Presentation
- Over 10 000 vector stencils
- Export to vector graphics files
- Export to Adobe Acrobat® PDF
- Export to MS PowerPoint®
- Export to MS Visio® VSDX, VDX
|

 Data Visualization and Sharing