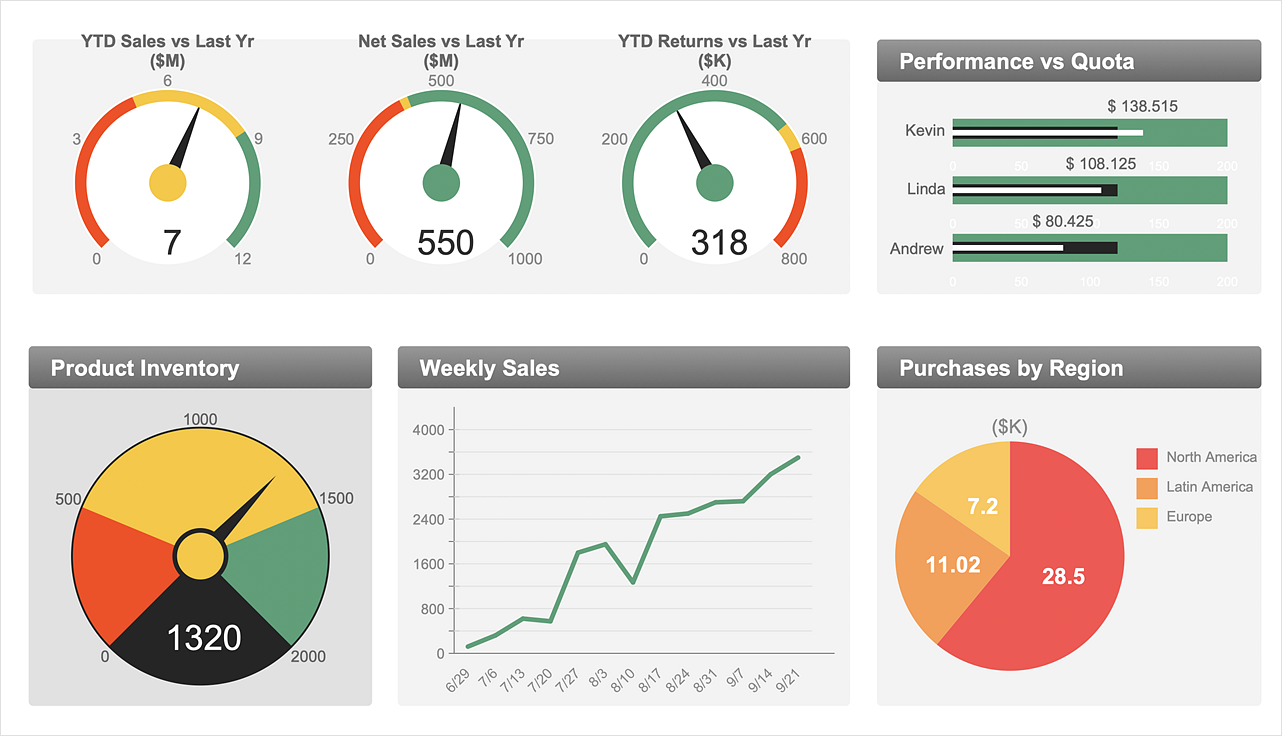
How to Use ConceptDraw Sales Dashboard SolutionSales Dashboard is a visual representation of a set of sale KPIs, grouped and arranged in a special way. All the KPIs are placed on one screen and all changes can be tracked quickly and easily. ConceptDraw Sales dashboard solution is designed to help sales organizations gain maximum benefits from timely and reliable information to improve the quality of decisions and improve sale performance. Using ConceptDraw Sales Dashboard allows to view at a glance the sale performance and to monitor the main sales KPIs. The custom sales dashboard displays real-time information on sales performance KPIs with the help of intuitive and easy-to-understand diagrams and charts.


Result:Your Sale Dashboard shows the actual data from Excel data source files. To make changes through the entire dashboards, you need just to change the values in the Summary Table. The Live Objects will refresh the data every 5 seconds. So as the data updates in the data source files, the Live Object shows the new data within the next 5 seconds. |
How it works:
Useful Solutions and Products:
|
 How To Use Solutions