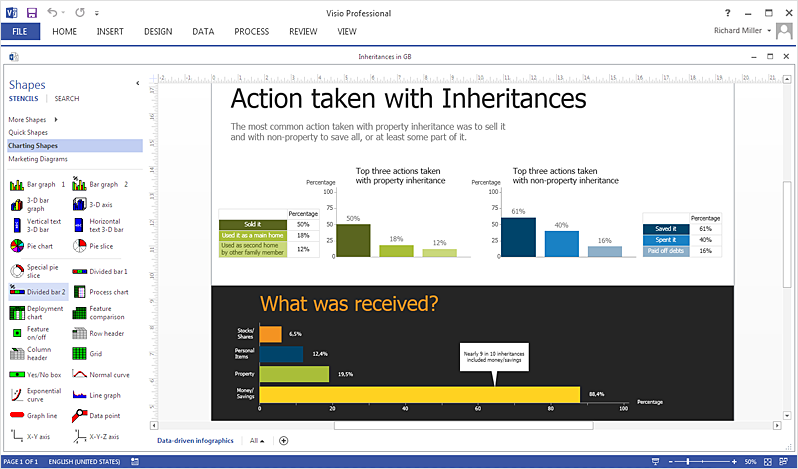
How To Create an MS Visio Data-Driven Infographics
A typical data-driven infographics graphically represent data that changes over time. The ability to design data-driven infographics quickly and easily contains in the Data-Driven Infographics solution. You can easily exchange your infographics with MS Visio users since ConceptDraw DIAGRAM allows you to export your diagrams to MS Visio 2013 (VSDX) files.
- Run ConceptDraw DIAGRAM.
- Open your data-driven infographics, created using ConceptDraw DIAGRAM.

- From the File menu, select Export.
- Select Microsoft Visio 2013 (VSDX).
- From the Open window, select the desired file to be exported. Click “OK”.
Result: You can easily design an infographic pack for your business documentation and share it easily with MS Visio users.
|
How it works:
- Set of ready-to-use templates supplied with ConceptDraw DIAGRAM
- Collection of professional samples supports each template
Useful Solutions and Products:
- Block Diagrams
- Bubble Diagrams
- Circle-Spoke Diagrams
- Circular Arrows Diagrams
- Concept Maps
- Flowcharts
- Data Driven Charts
- Special templates
- Infographic examples
- Diagraming and Charts
- Vector Illustrations
- Maps
- Floor plans
- Engineering drawings
- Business dashboards
- Infographics
- Presentation
- Over 10 000 vector stencils
- Export to vector graphics files
- Export to Adobe Acrobat® PDF
- Export to MS PowerPoint®
- Export to MS Visio® VSDX, VDX
|

 Data Visualization and Sharing