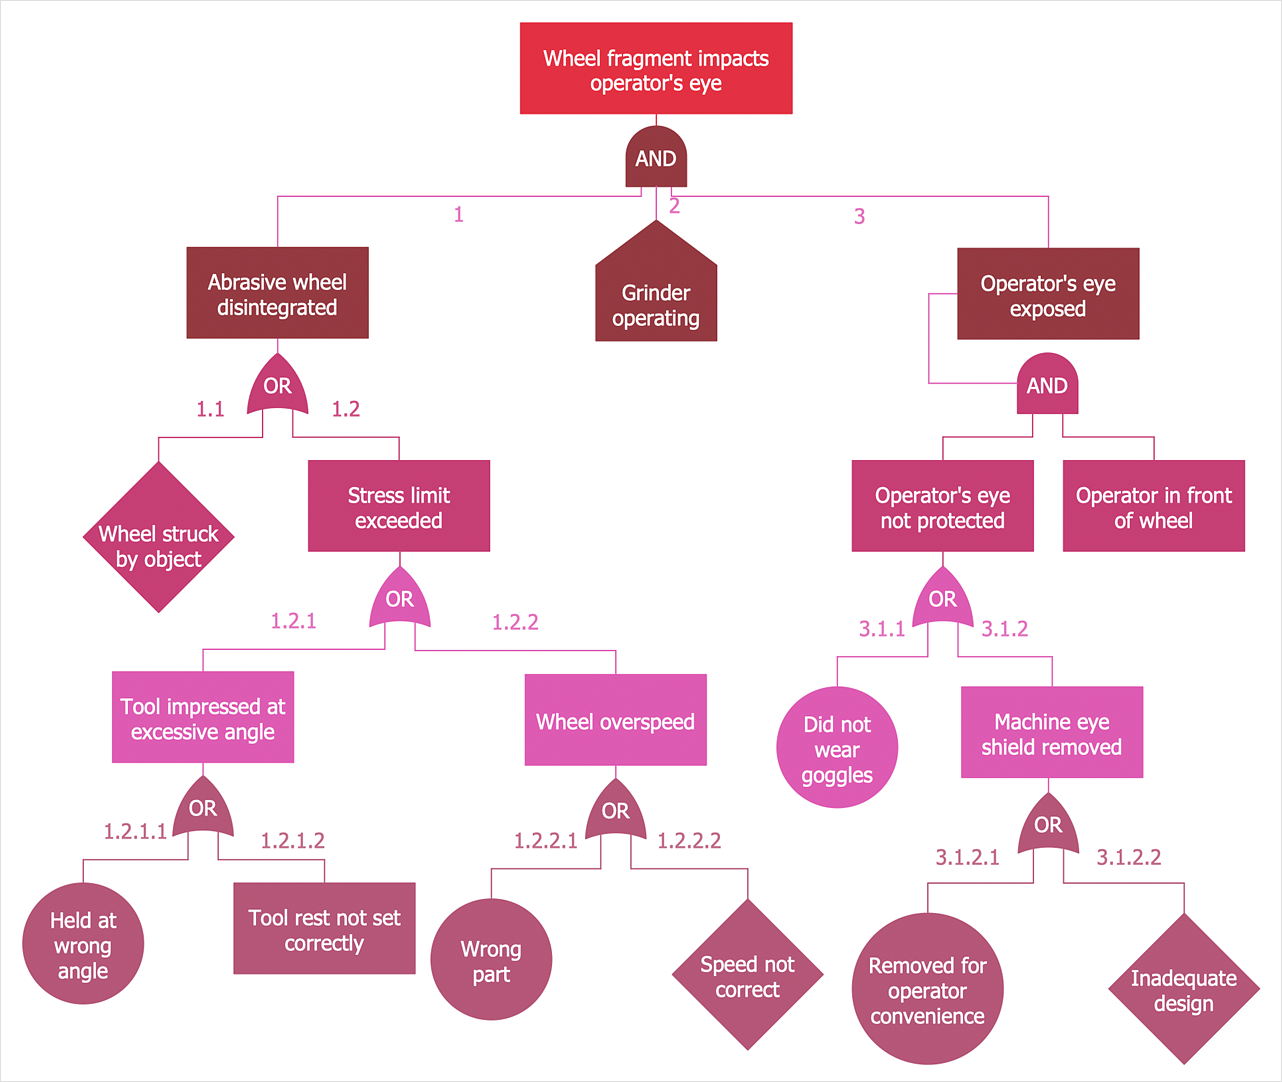
How to Create a Fault Tree Analysis Diagram (FTD)
The failure of an item in a system is often caused by the failure of other items. Fault Tree Analysis, or FTA, provides a method of breaking down such chains of failures, with a key addition for identifying combinations of faults that cause other faults. Fault Tree Analysis Diagrams (or negative analytic trees) are logic block diagrams that display the state of a system (top event) in terms of the states of its components (basic events). ConceptDraw DIAGRAM allows you to create professional FTA Diagrams using the Fault Tree Analysis Diagrams solution.
- Open a ConceptDraw DIAGRAM new document and select the Fault Tree Analysis Diagrams library.
- Add the proper FTD elements to the diagram by dragging them from the library to the document page.
- The Fault Tree diagram should be started with the Event symbol for top-level failure event.

- Use the OR gate symbol to the output event occurs if at least one of the input events occurs.

- The Basic event symbol is used for event that does not have any contributory events.

- An AND gate symbol means the output event occurs if all input events occur.

- Use the Exclusive OR gate symbol to the output event occurs if exactly one input event occurs.

- Next, you need to connect the objects. To do this, select the neighbor objects and click the Chain Connection
 button. button.

- Change objects' appiarence using the Format panel options.

- To add text to an object, select it, and then start typing. When you are finished, click outside the object.
- To distribute objects at regular intervals, select the objects, and then, on the Arrange&Size panel, pick a needed option from the Align and Distribute section.

- To align objects horizontally or vertically, select the objects you want to align, then, on the Arrange&Size panel, select the proper option from the drop-down menu.

Result: Fault Tree Analysis Diagram helps you to analyze the probability of functional system failures and safety accidents.

|
How it works:
- Set of ready-to-use templates supplied with ConceptDraw DIAGRAM
- Collection of professional samples supports each template
- Professional drawing tools
Useful Solutions and Products:
- Easily draw charts and diagrams
- Visualize business information
- Capture a different phases of the project, using diagrams
- FTD diagrams samples and templates
- Library of vector stencils
- Diagraming and Charts
- Business Process diagrams
- Business Process Modeling Notation (BPMN 2.0)
- Business Model Presentation
- Over 10 000 vector stencils
- Export to vector graphics files
- Export to Adobe Acrobat® PDF
- Export to MS PowerPoint®
- Export to MS Visio® VSDX, VDX
|


 Business-specific Drawings


 button.
