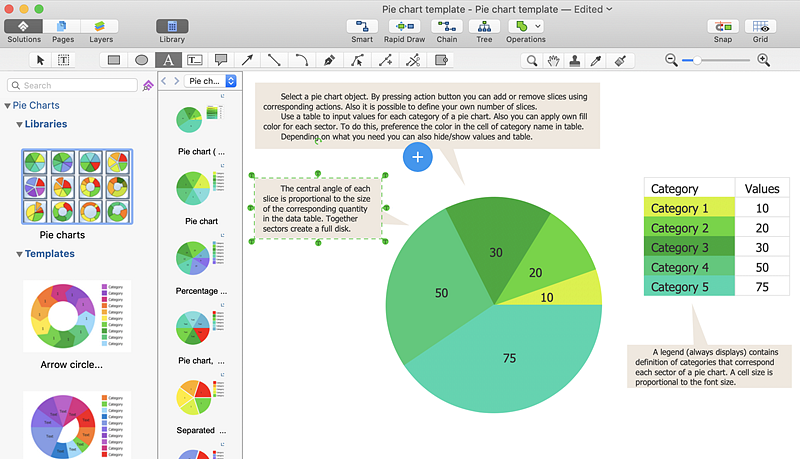
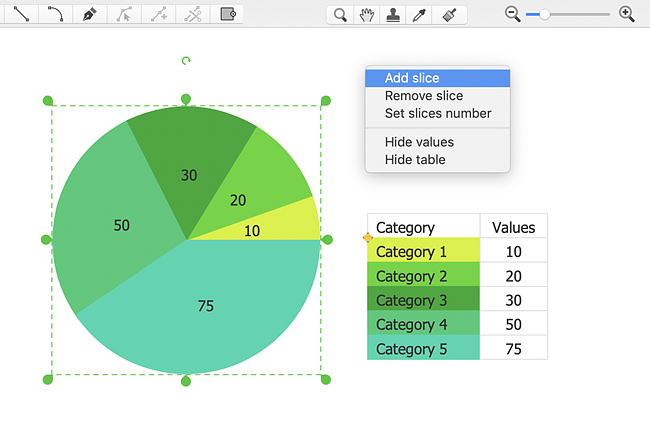
How to Draw a Pie ChartPie charts are a visual data display method which could be given in a small table. Pie charts are useful for showing data that are classified in the nominal or ordinal categories. Pie charts are typically used to show proportional data. Pie charts are good for visual comparisons, so they are often used in marketing. For example, it is difficult to imagine a more intuitive way to show segmentation and market share. ConceptDraw DIAGRAM allows you to draw a simple and clear Pie Chart using special library. The ability to create pie charts is contained in the Pie Charts solution. The solution provides a set of special tools for creating pie charts.
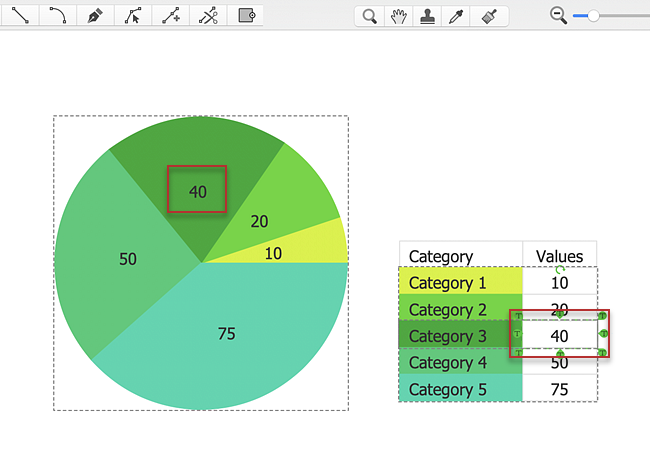
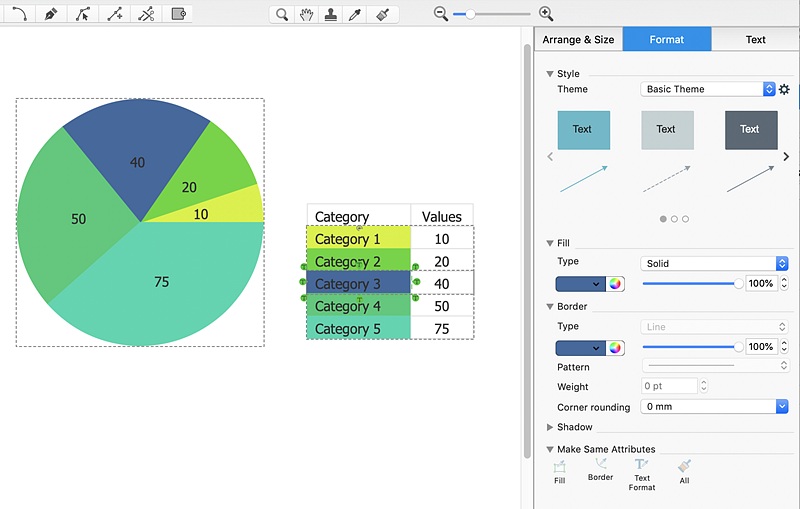
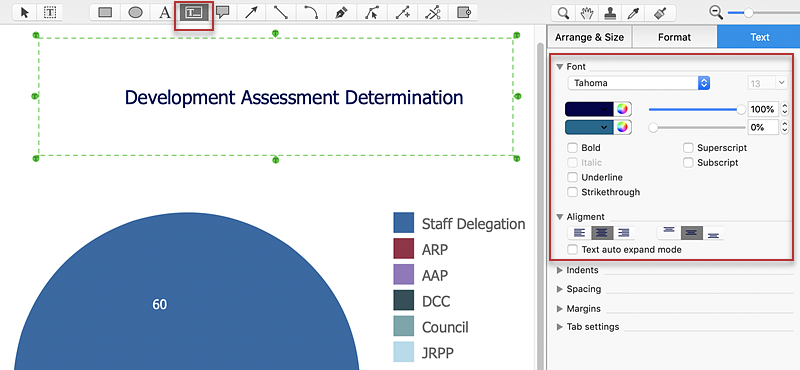
Result: Now using the Pie Chart, you can visually estimate the relative contribution that different data categories contribute to a whole value. |
How it works:
Useful Solutions and Products:
|
 Business-specific Drawings