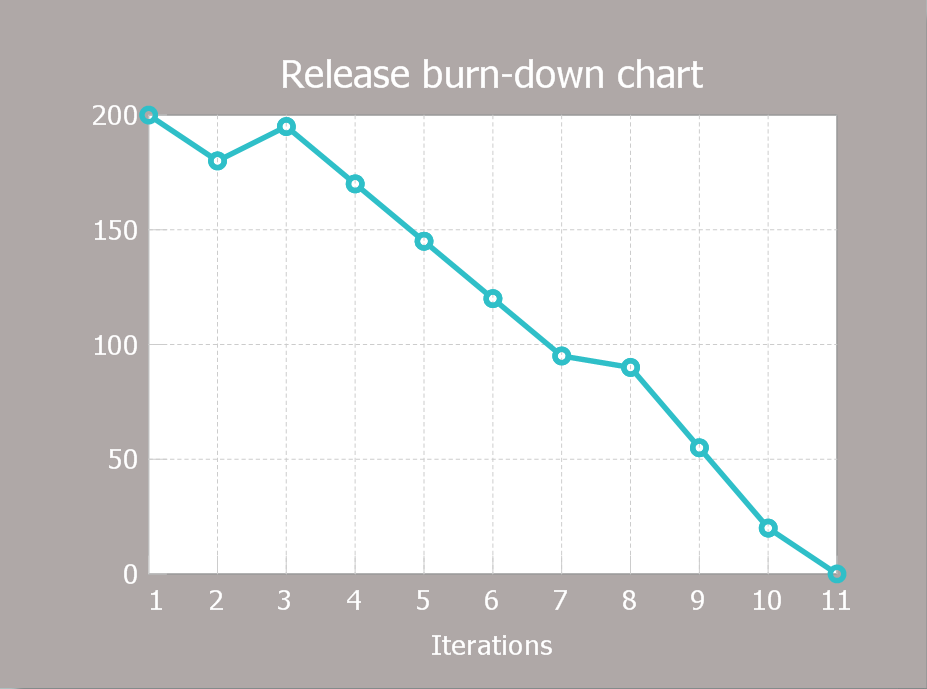
How to Create a Release Burn-Down ChartThe Agile methodology provides project teams the ability to quickly adapt the project to the current situation and thus achieve maximum productivity. According to the Scrum method, the steps needed to fulfill the project goal breaks down by using short sprints or iterations. The iterations together with an extensive collaboration can increase productivity by better understanding the entire flow of a project. A Release burn-down chart is used to track progress on a Scrum project. It should be updated at the end of each iteration. The horizontal axis of the release burn-down chart represents the iterations; the vertical axis shows the amount of work remaining at the start of each sprint. Work remaining can be displayed in story points. The Scrum Workflow solution is a paid add-on to ConceptDraw DIAGRAM that provides Agile project team the ability to quickly build any professional Scrum diagram such as a Release velocity chart, Release burn-down chart, Sprint burn-down chart, or a Team velocity chart.
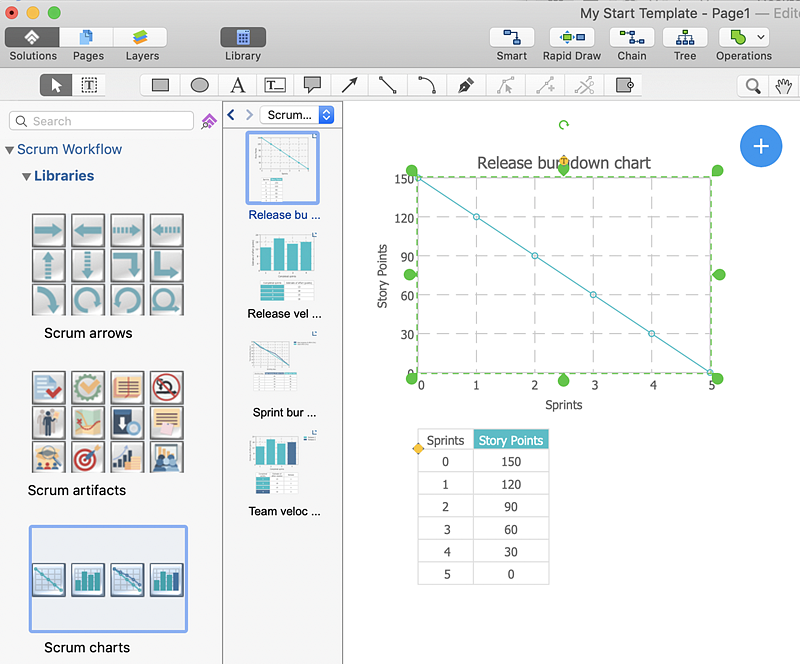
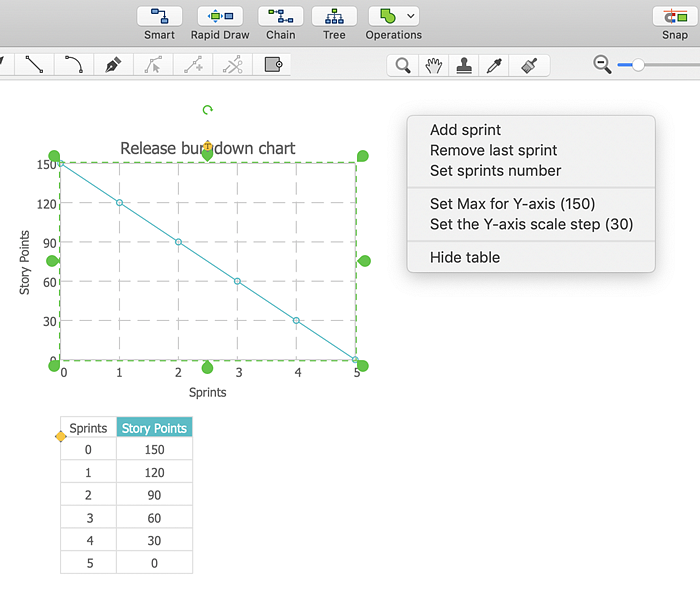
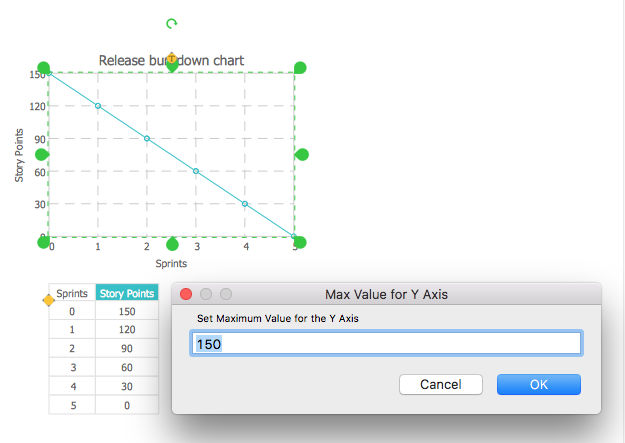
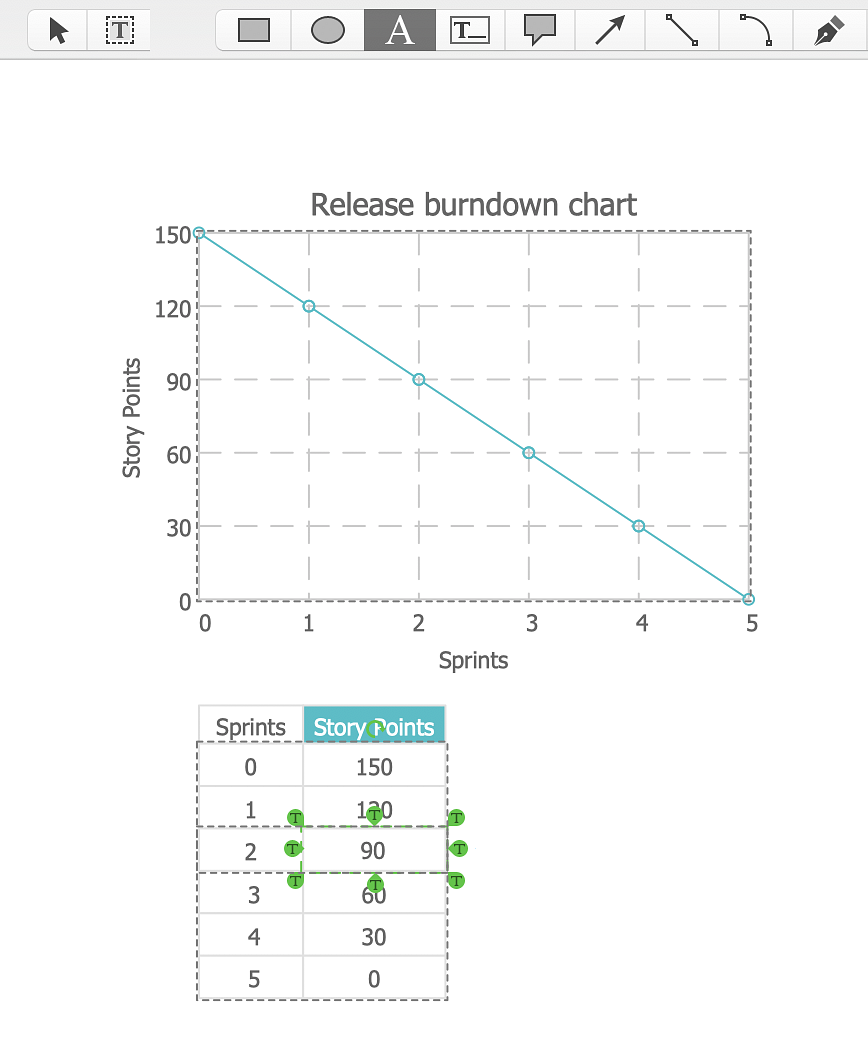
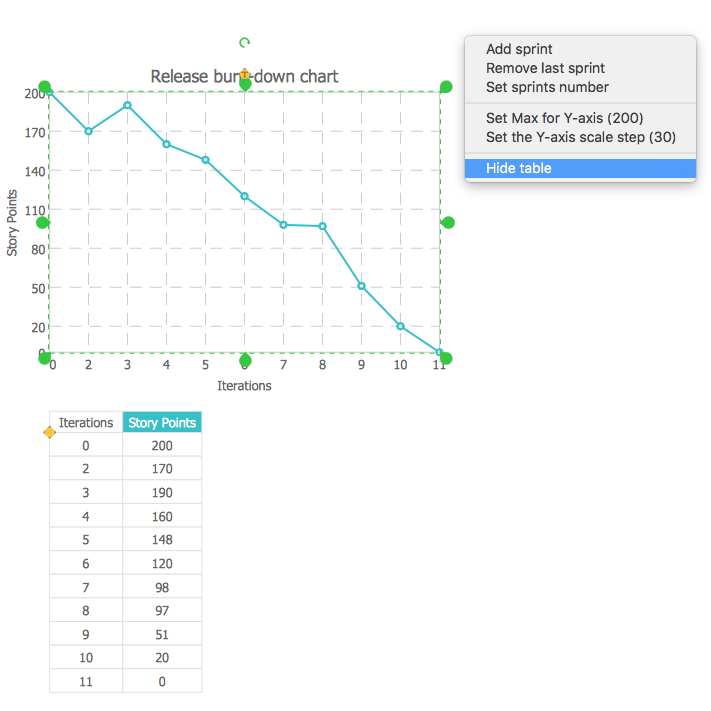
Result: The Release burn-down chart is an important part of Agile project communication flow. It provides the Agile team with a clear vision of the project progress. |
How it works:
Useful Solutions and Products:
|
 Business-specific Drawings