How to Customize Columns in Your Project Schedule
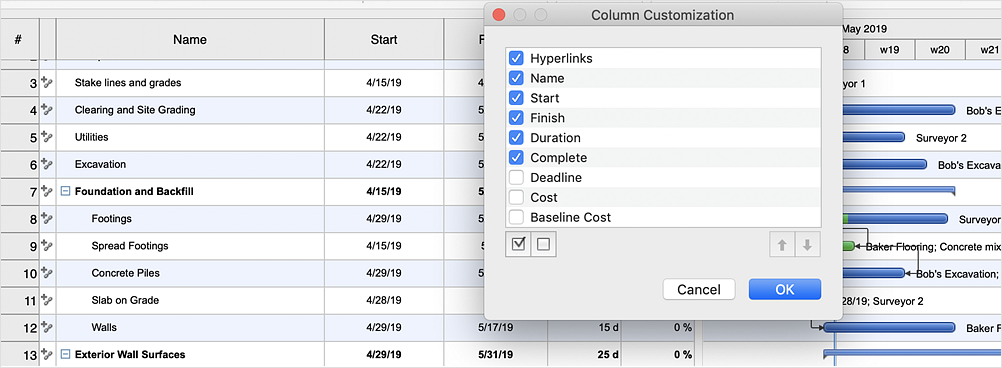
ConceptDraw PROJECT allows customizing the columns displayed in a Gantt chart, Multiproject View, Resource View and Resource Usage View enabling users to show the data they want. There is a lot of useful data in your project. Select which data points you want to display with Column Customization.
- Right-click (CTRL-click on Macs without a two-button mouse) on the project data column header.
- Select Column Customization.
- Check and uncheck the different items you want in your Gantt chart, and arrange the columns using the Move Up and Move Down buttons.
- Click OK.
Result: Now the information listed in the project views contain the custom columns selection.
|
How it works:
- An extensive variety of reports on project and task statuses
- Centralizes project information via embedded documents and hyperlinks
- Managing multiple projects from a single file
- Powerful integration with other ConceptDraw products
Useful Solution and Products:
- Quickly start a project
- Plan and execute projects efficiently
- Visualize different phases of the project using diagrams
- Import and export MS Project® files
- Share your project data with MS Project®, Merlin®, and OmniPlan® users
- Report project status as a mind map
- ConceptDraw MINDMAP
Process, Brainstorming & Thought Organization
- ConceptDraw PROJECT
Project & Resource Management
- ConceptDraw DIAGRAM
Business Diagramming & Illustration
|
 Create Project File