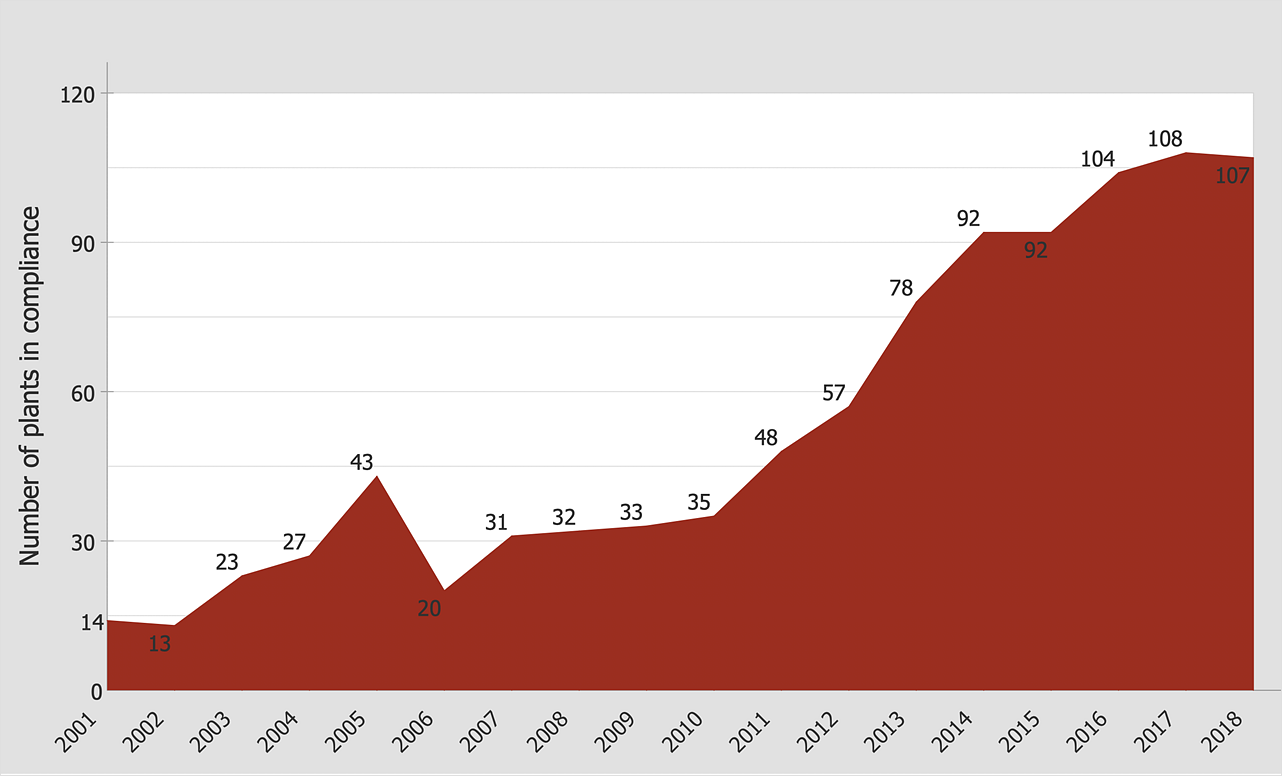
How to Draw an Area ChartUsing an area chart is a visual way to compare two or more quantities. An area chart displays a series as a set of points connected by a line, with all the area filled in below the line. ConceptDraw DIAGRAM allows you to draw a simple and clear Area Chart using the Area Charts solution.


Result: Now using the area chart, you can visually estimate the contribution from different categories and compare two or more quantities. |
How it works:
Useful Solutions and Products:
|
 Business-specific Drawings