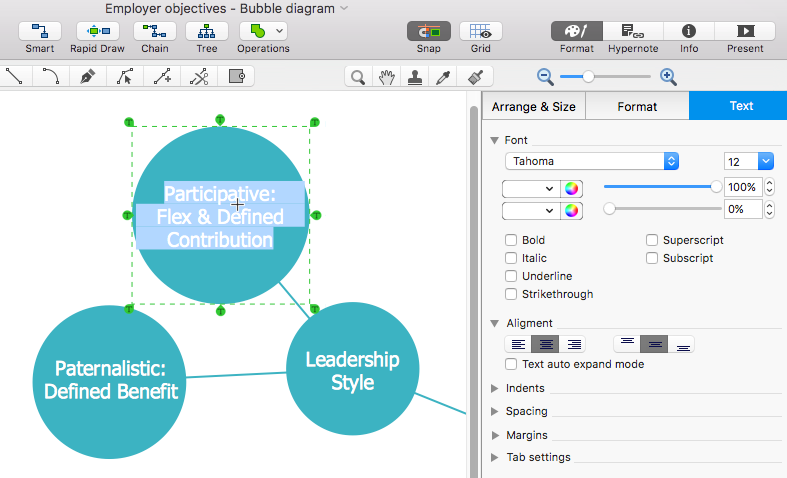
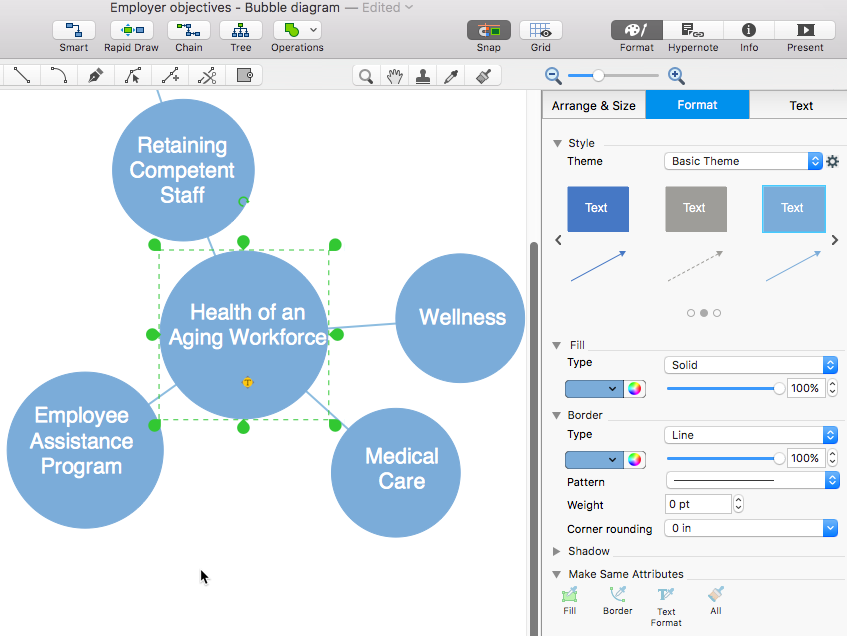
How to Create a Bubble DiagramA bubble chart is a diagram which shows information graphically in the form of groups of bubbles. Bubble diagrams can be used to compare the related topics, and determine places of similarity and difference. Bubble diagrams can be applied for modeling of both physical and abstract structure. Bubble diagrams are commonly used by architects and landscape designers to make a visual representation of space required for facilities in a building or developed area. Basically, bubble diagrams provide the possibility to place bigger value on certain subjects or processes, using multiple central nodes to represent sales, marketing, and production departments within a single company. ConceptDraw DIAGRAM allows you to draw a bubble diagrams using the Business Diagrams solution.


Result: Bubble charts are often used during the early stages of product development to visualize thoughts and ideas for the purpose of sketching out a development plan. |
How it works:
Useful Solutions and Products:
|
 Business-specific Drawings
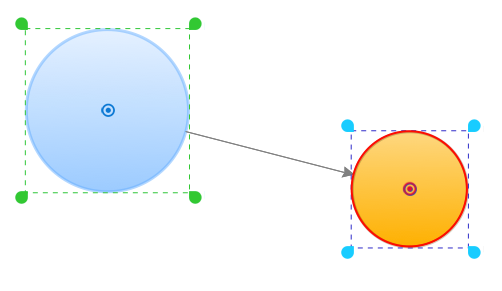
  . To connect elements using this tool, drag the connector from one connect dot to another.