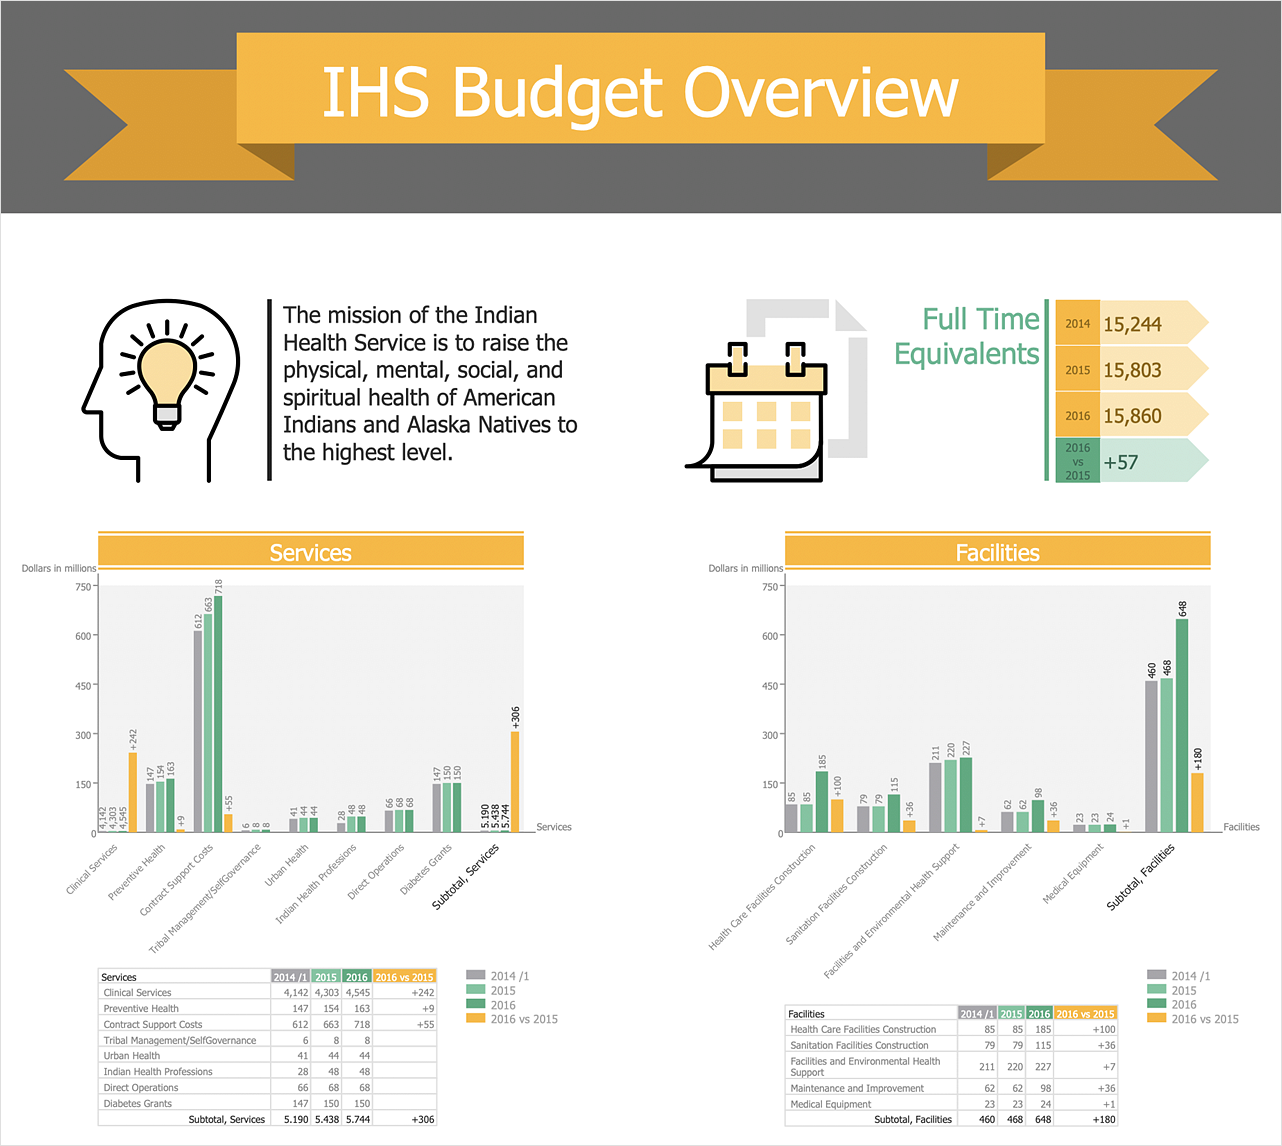
How to Create Financial InfographicsInfographics commonly used to display a lot of information in a single, visually-appealing graphic. Financial infographics allow to visualize the dynamic of commercial and financial data and illustrate the financial success of the commercial organization for a certain period. A financial report created using financial infographics containing graphs, charts, and illustrations of different types the most clearly reflect the financial result of the company and allow the stakeholders to assess instantly the degree of its profitability. Ability to create Financial Infographics in ConceptDraw DIAGRAM is contained in the Financial Infographics solution. The Financial Infographics solution is a paid add-on to ConceptDraw DIAGRAM that provides users with a powerful and easy to use Infographics tool for an economical price. The Financial Infographics solution is perfect for visual communication and illustration the documents, reports, and presentations about finances: money, accounting, banks, taxes, expenses and incomes, savings, investments, currencies, budget and more.


Result: You can accelerate your success in visualization of financial data, statistics, and reports. Vivify commercial presentations and analytic documents with modern and convenient infographics drawing tools of Financial Infographics solution. |
How it works:
Useful Solutions and Products:
|
 Business-specific Drawings