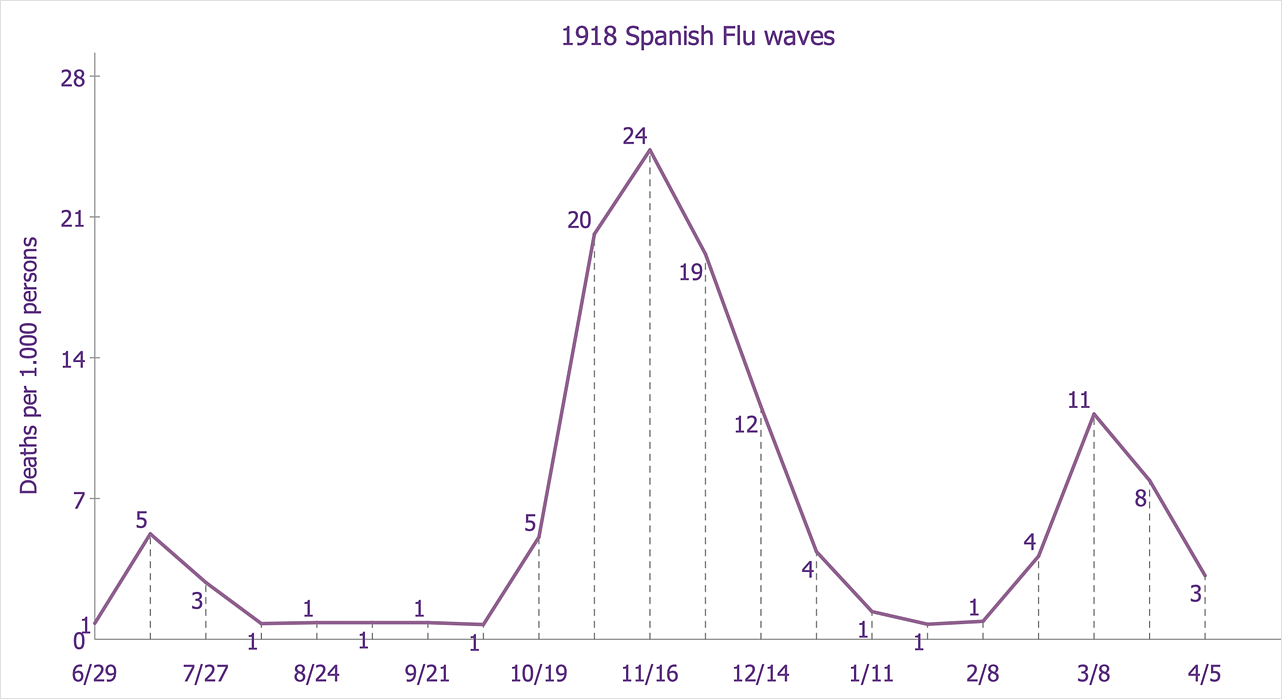
How to Draw a Line Chart QuicklyUsing a Line chart is a way to show a relationship between two sets of data points. Line graphs (line charts) are most often used to visualize data that changes over time. A Line Graph shows how a change of one parameter affects the value of another. It is widely used in business. For example, the line chart used in a market analysis. A line chart in trade depicts prices or number of sales over time. Generally, the Line chart provides a visual representation of the change of values, depending on certain factors. For example, you can make a line graph of how the certain animal gains weight over time, or as the average temperature in the city varies from month to month. ConceptDraw DIAGRAM allows you to draw a Line Chart quickly and easily using special libraries, supplied by the Basic Line Graphs solution.
Line graph (text -> height) shapes.


Line graph (control dots) shapes.


Result: It is useful to use a Line chart as certain values are shown, predictions can be made and trends in data are easily shown. |
How it works:
Useful Solutions and Products:
|
 Business-specific Drawings