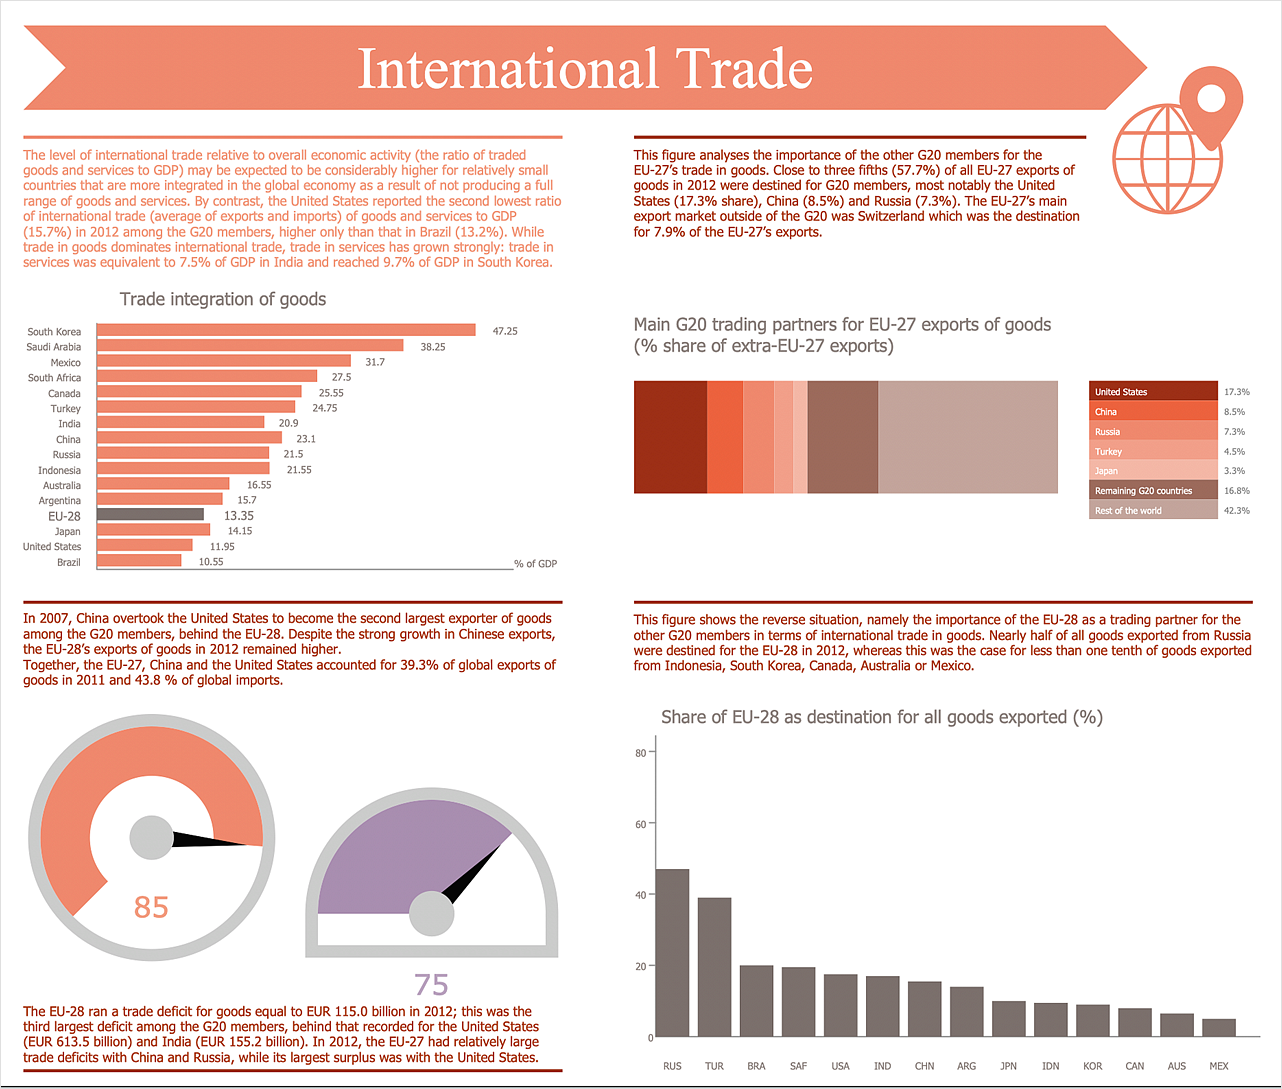
Infographics is used in marketing to display a lot of information in a single, visually-appealing graphic. It includes bar graphs, pie charts, histograms, line charts, e.t.c. Marketing infographics contain detailed illustrations, charts, and data that display a lot of information in a single, visually-appealing picture.
Ability to create Marketing Infographics in ConceptDraw DIAGRAM is contained in the Marketing Infographics solution. The ConceptDraw Marketing Infographics Solution is a paid add-on to ConceptDraw DIAGRAM, that provides users with a powerful and easy to use Infographics tool for an economical price.
- Run ConceptDraw DIAGRAM.
- Select the Marketing Infographics item in the Solutions panel.
- Doubleclick the preview of Marketing Infographics template to open the template in ConceptDraw DIAGRAM.
- Add objects to the drawing by dragging them from the library to the document page.
- To make changes in your infographic elements use the Action button menu. To open the menu select an object and click the
 button in the upper right corner of the object.

- To change value of an interactive chart, select it and type the new value and a chart will be automatically changed.

- Add a text to infographics.
- Use the Line, Fill, Shadow and Text tools to format infographic objects. Find them in the Format panel.
- Finally, you can export your drawing as MS PowerPoint® and Adobe PDF files using Export options from the File menu.

Result: Marketing Infographics can be used to quickly communicate a message, to simplify the presentation of large amounts of data, to see data patterns and relationships, and to monitor changes in variables over time. Using ConceptDraw DIAGRAM you can easily make marketing infographics of any complexity.


 Business-specific Drawings