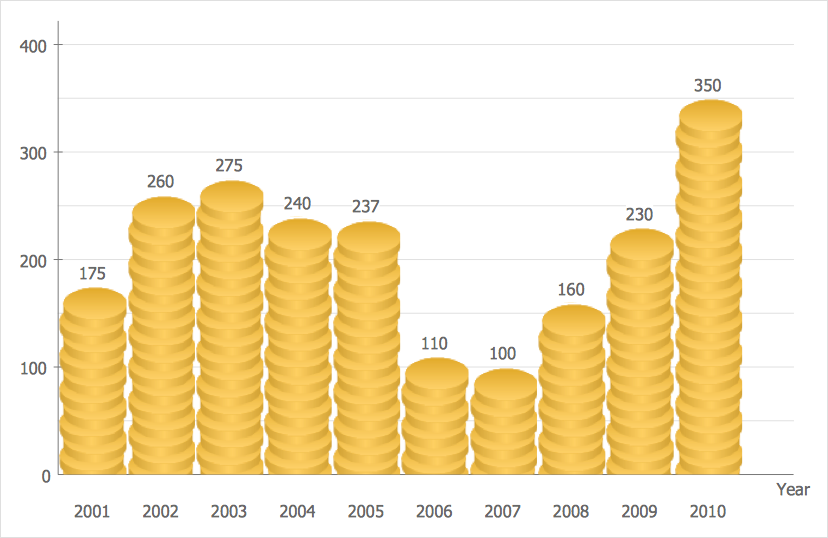
How to Create a Picture GraphA Picture Graph is a simple kind of marketing diagram used to show the relationship among various quantities. It includes pictures or symbols to represent information visually. When you have to show and compare some values you can use the visual tools. You can make a simple picture graph using memorable symbols to get the best visual presentation. Using specific symbols instead of regular colored lines and bars makes a picture graph a much more valuable visual tool. ConceptDraw DIAGRAM allows you to draw simple and clear pictorial charts using the Picture Graphs solution.


Result: Picture Graphs are used commonly to represent non-complex data to a large audience. |
How it works:
Useful Solutions and Products:
|
 Business-specific Drawings