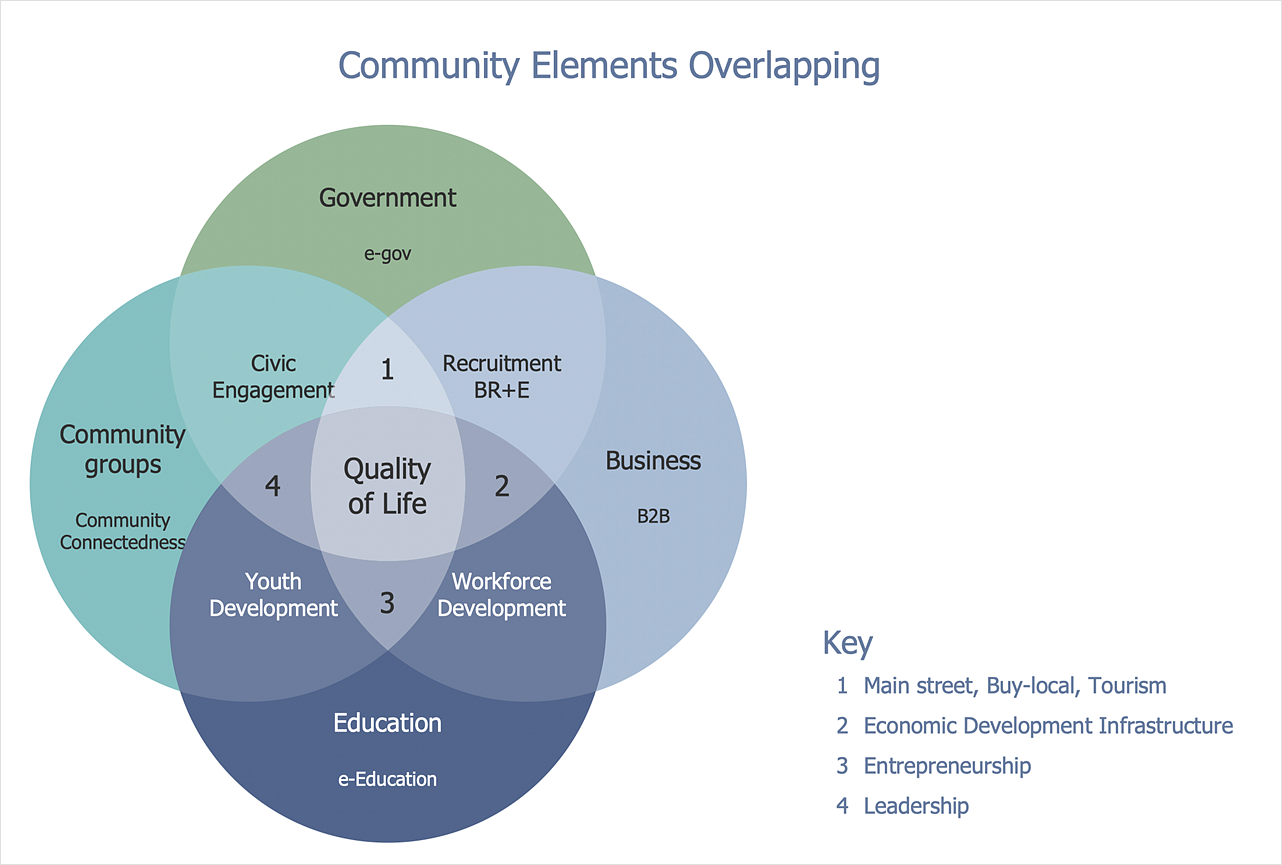
How to Create a Venn DiagramA Venn Diagram is a diagram that shows all the possible logical relations between the sets. Venn diagrams are used to illustrate simple set relationships in probability, logic, statistics, mathematics, sociology, philosophy, etc. Each circle, a Venn diagram consists, shows a specific group or set. The categories which are displayed by circles commonly have some overall properties. A Venn Diagram shows the possible relationships between these categories. Any properties that belong to more than one circle should be placed in the sections where the circles intersect. A Venn Diagram is used to visually summarize the status and future viability of a project. A Venn Diagram is also widely used in marketing. ConceptDraw DIAGRAM allows you to draw Venn diagrams using the Basic Venn Diagrams solution.


Result: Venn diagrams can be useful ways to visually summarize the status and future viability of a project. |
How it works:
Useful Solutions and Products:
|
 Business-specific Drawings