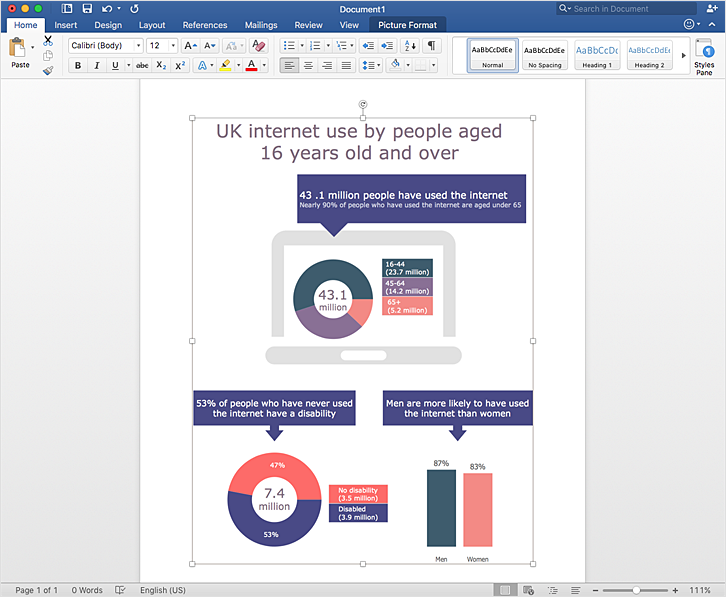
How to Add Data-driven Infographics to MS Word DocumentMaking data-driven infographics involves different elements, such as bar graphs, pie charts, histograms, line charts, that can be managed using ConceptDraw DIAGRAM The ability to design data-driven infographics quickly and easily contains in the Data-Driven Infographics solution. The data-driven diagrams may be the part of the business documentation that should be presented as MS Word document. In this case, the best way is using the advanced copy-and-paste functionality of ConceptDraw DIAGRAM

Result: You can easily supplement any MS Word document with diagrams and infographics. |
How it works:
Useful Solutions and Products:
|
 Data Visualization and Sharing