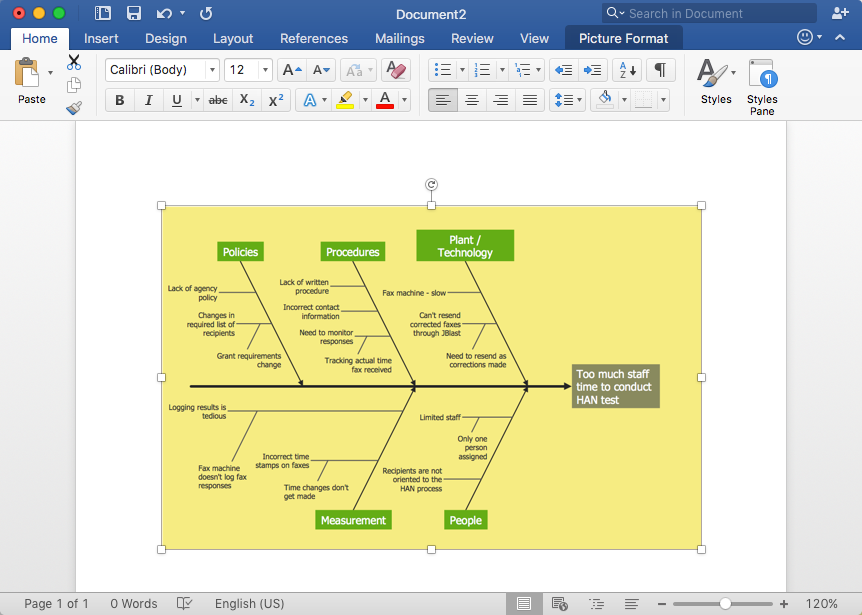
How to Add a Fishbone (Ishikawa) Diagram to an MS Word Document
The Fishbone diagram is used to visualize the relationship between an event and the factors that influenced it. It often used in management to identify the possible causes of a problem in order to eliminate them. The ability to make Fishbone diagrams contains in the ConceptDraw Fishbone Diagrams solution. The Fishbone diagram may be the part of the Cause and Effect analysis documentation that should be presented as MS Word document. In this case, the best way is using the advanced copy-and-paste functionality of ConceptDraw DIAGRAM
- Run ConceptDraw DIAGRAM
- Open a Fishbone diagram, created with ConceptDraw DIAGRAM

- Select the entire drawing, or a part of it.
- Copy selected objects.
- Paste them into your MS Word document.
Result: You can easily supplement any MS Word document with diagrams.
|
How it works:
- Data exchange capabilities between
ConceptDraw MINDMAP and PRO
- Powerful management diagramming tool
Useful Solutions and Products:
- Management Diagrams: Matrixes, Deployment Charts,
- Organizational Charts, Fishbone Diagrams, Timelines.
- Mind Maps: Decision Making, Scheduling,
- Thinking Ideas, Problem Solving, Business Planning,
- Company Organizing, Meetings and Presentations.
- Marketing diagrams samples and templates
- Library of vector stencils
- Diagraming and Charts
- Vector Illustrations
- Maps
- Floor plans
- Engineering drawings
- Business dashboards
- Infographics
- Presentation
- Over 10 000 vector stencils
- Export to vector graphics files
- Export to Adobe Acrobat® PDF
- Export to MS PowerPoint®
- Export to MS Visio® VSDX, VDX
|

 Data Visualization and Sharing