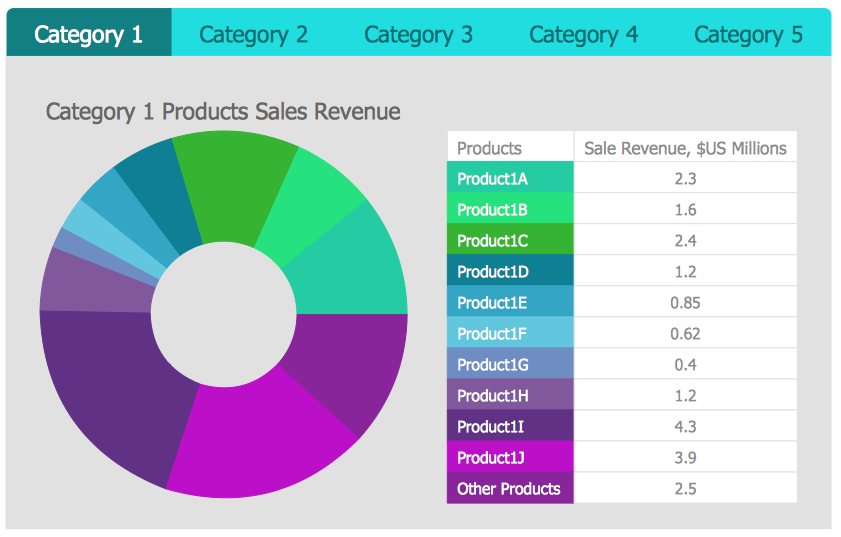
How to Make Business Intelligence DashboardThe purpose of making visual business dashboards is to help professionals make more informed decisions in business. Displaying business intelligence data in dashboard delivers your team the at-a-glance look on how things are going. The effective business dashboard provides vivid, real-time visibility of business process to your team enabling you to collect and analyze information on the most important and business-driving data. Using dashboard you can easily make a comparison between different process states and make the most rational decision on further changes. ConceptDraw DIAGRAM allows you can easily create a visual dashboard using Live Objects. The advantage of Live Objects technology is that a live object can be easily connected to a data source to visualize the actual values of any performance metrics. ConceptDraw Business Intelligence Dashboard solution contains a rich library of live charts and indicators.
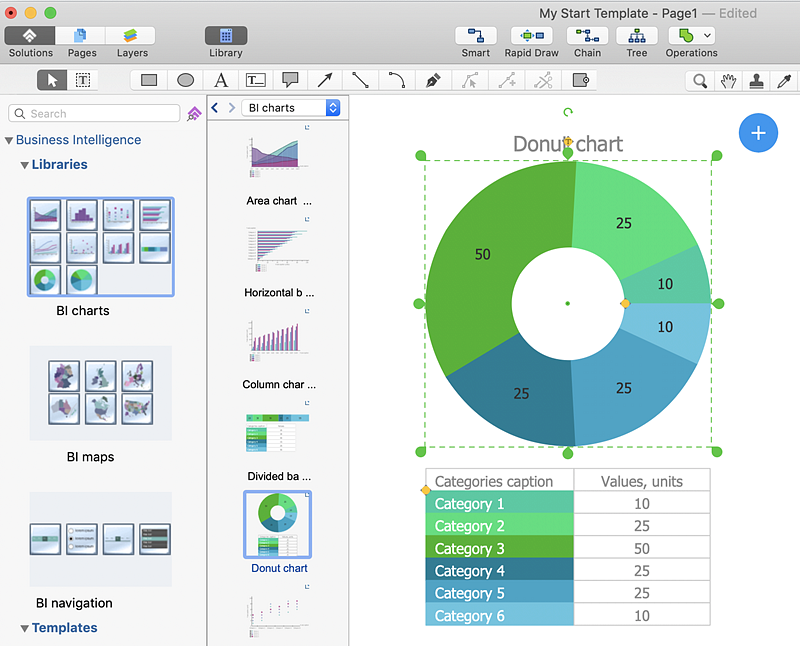
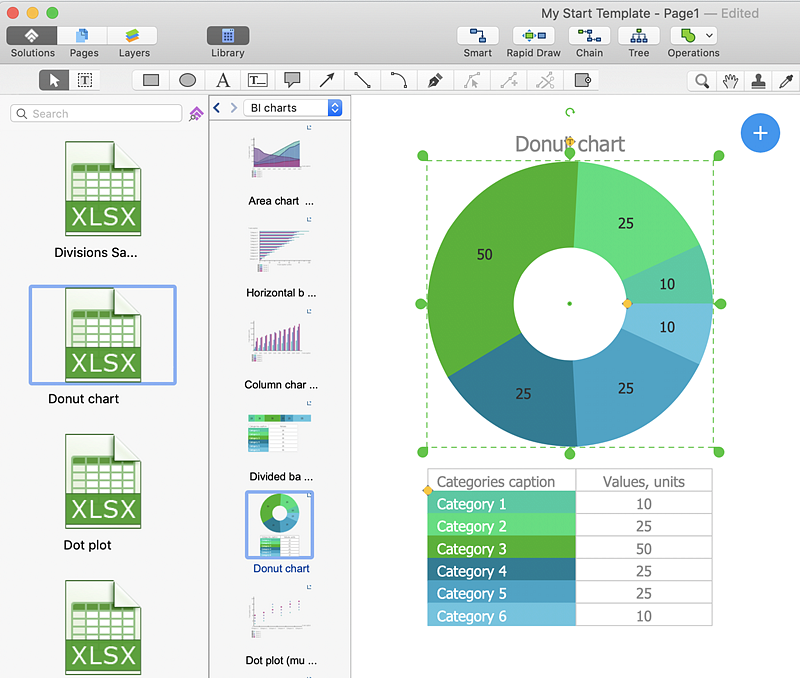
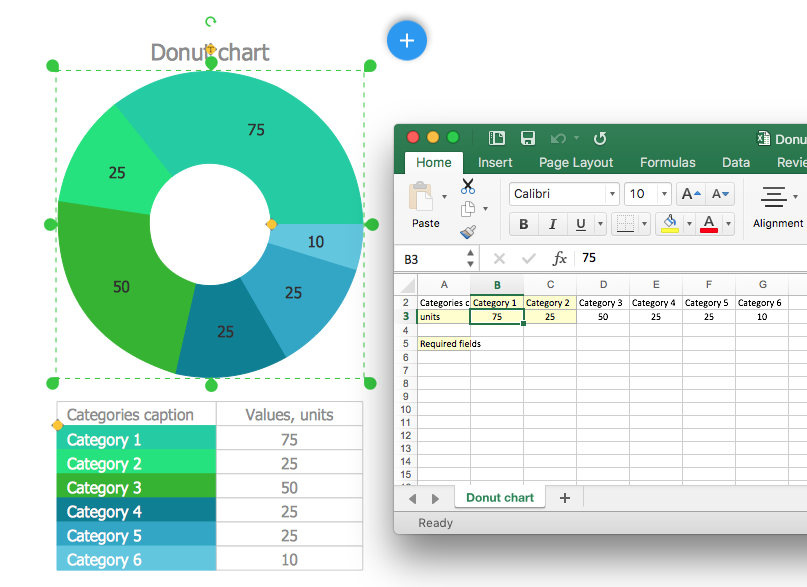
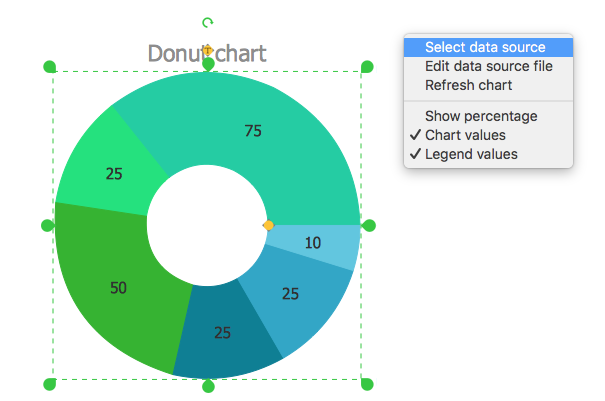
Result: Now your visual dashboard shows the actual data from your data source files. The Live Objects will refresh the data every 5 seconds. So as the data updates in one of the data source files, the corresponding Live Object on your dashboard shows the new data within the next 5 seconds. |
How it works:
Useful Solutions and Products:
|
 Visual Dashboards