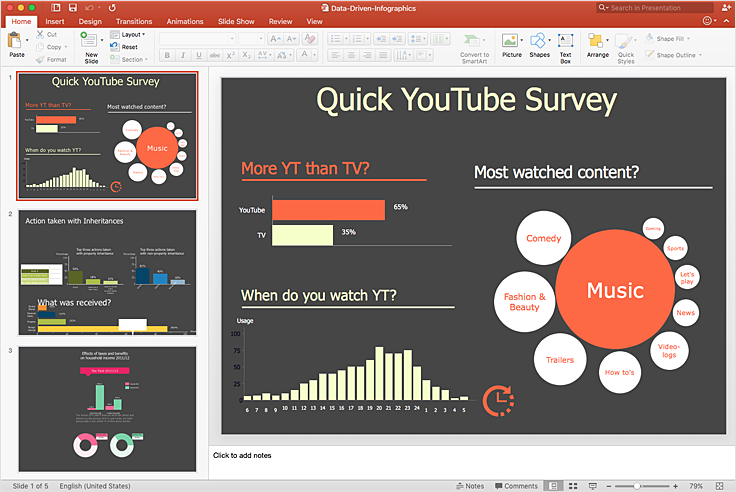
How to Make PowerPoint Presentation of Data Driven InfographicsData-driven Infographics are often used in management and marketing to visually represent data making them easily understandable at a glance. Data-driven Infographics can contain bar graphs, pie charts, histograms, line charts, e.t.c. The PowerPoint presentation of large amounts of data in a graphic format can be very informative and helpful.


Result: ConceptDraw DIAGRAM allows you to make a MS PowerPoint Presentation from your Data-driven infographics in a few simple steps. |
How it works:
Useful Solutions and Products:
|
 Data Visualization and Sharing
  button