How To Make an EXPRESS-G Diagram
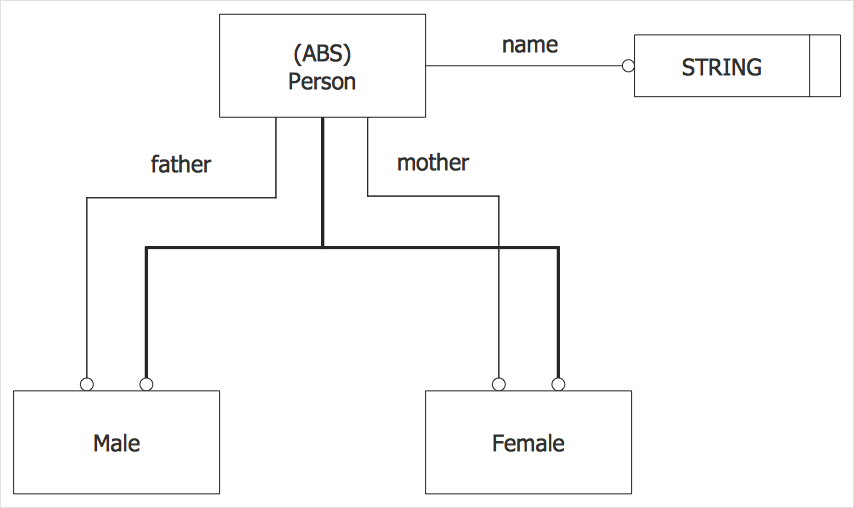
The Express object-oriented language is universal and is used to describe the static structures and their properties using entities, attributes, types, and their relationships. EXPRESS-G is an addition to the EXPRESS standard and is used for graphical modeling notation of informational models. The data model at the use of EXPRESS-G graphical representation has a more simple and more understandable structure. This article shows how to build EXPRESS-G on the example of a data model that illustrates the family schema. This model includes the supertype entity Person with two subtypes Male and Female. The entity Person is declared as abstract (ABS), so only occurrences of Male and Female subtypes can exist. Each occurrence of a person obligatory has the name attribute and optional mother and father attributes. All notation shapes used in this EXPRESS-G diagram are commonly used in the charts of this type, thus are easily recognizable for readers.
- Run ConceptDraw DIAGRAM.
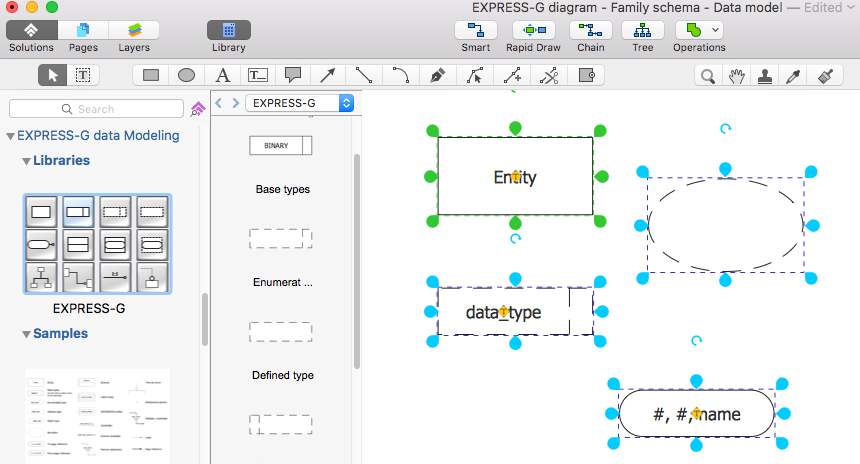
- Reveal the EXPRESS-G Diagrams in the Solutions panel. Open the EXPRESS-G library.
- Add objects to the diagram by dragging them from the library to the document page.

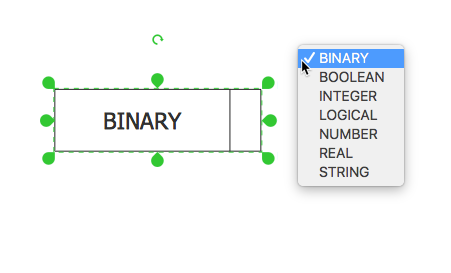
- Use the Action button menu to change diagram elements. Click the icon
 in the upper right corner of the object. in the upper right corner of the object.

- Add text to your objects — simply select objects by one and enter the text.
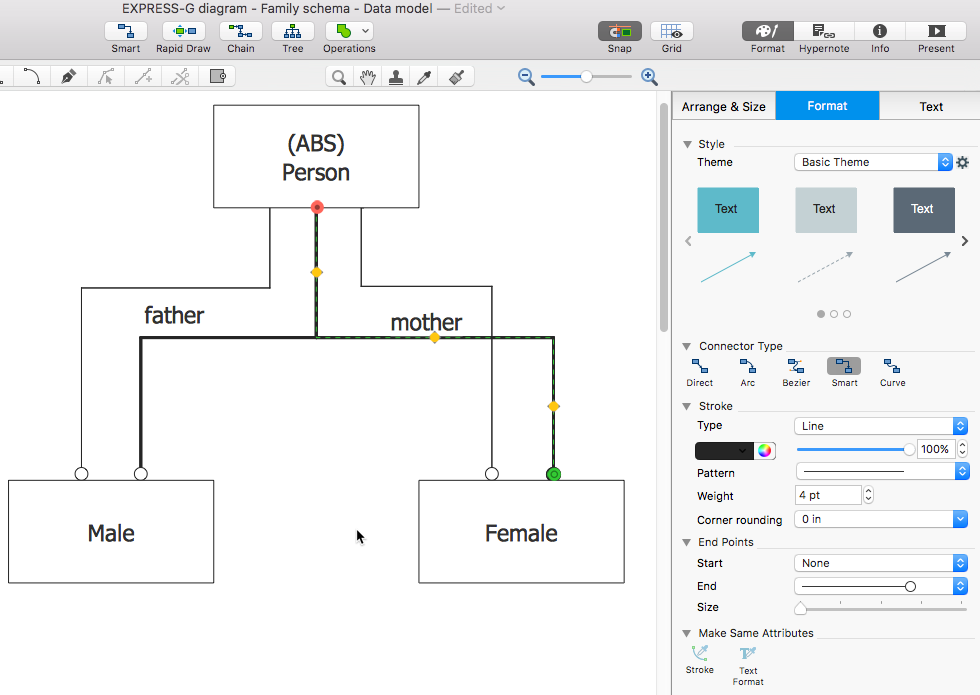
- Choose connection tool to depict the logical relationships in the model. In our example, we used the Smart connector
 . Connectors' attributes: type, thickness, color and endpoint type are specified using the Format panel. . Connectors' attributes: type, thickness, color and endpoint type are specified using the Format panel.

Result: This example, created using ConceptDraw DIAGRAM, supported by EXPRESS-G Diagrams Solution represents a sample family structure.

|
How it works:
- Set of ready-to-use templates supplied with ConceptDraw DIAGRAM
- Collection of professional samples supports each template
- Professional drawing tools
Useful Solutions and Products:
- Easily draw charts and diagrams
- Visualize business information
- Block Diagrams
- Bubble Diagrams
- Circle-Spoke Diagrams
- Circular Arrows Diagrams
- Concept Maps
- Flowcharts
- Venn Diagrams
- Android User Interface
- iPhone User Interface
- macOS User Interface
- Windows 10 User Interface
- Website Wireframe
- Rapid UML
- SYSML
- IDEF0 Diagrams
- Entity-Relationship Diagram (ERD)
- Data Flow Diagrams (DFD)
- Object-Role Modeling (ORM) Diagrams
- Diagraming and Charts
- Vector Illustrations
- Maps
- Floor plans
- Engineering drawings
- Business dashboards
- Infographics
- Presentation
- Over 10 000 vector stencils
- Export to vector graphics files
- Export to Adobe Acrobat® PDF
- Export to MS PowerPoint®
- Export to MS Visio® VSDX, VDX
|


 Business-specific Drawings
  . Connectors' attributes: type, thickness, color and endpoint type are specified using the Format panel.