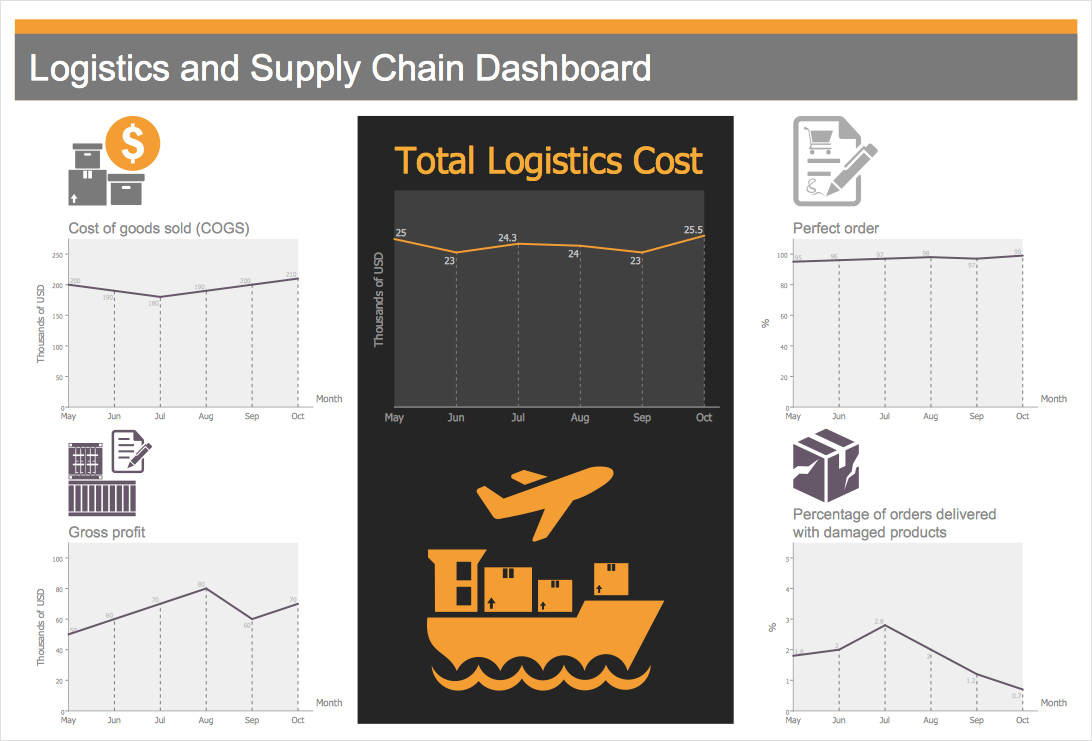
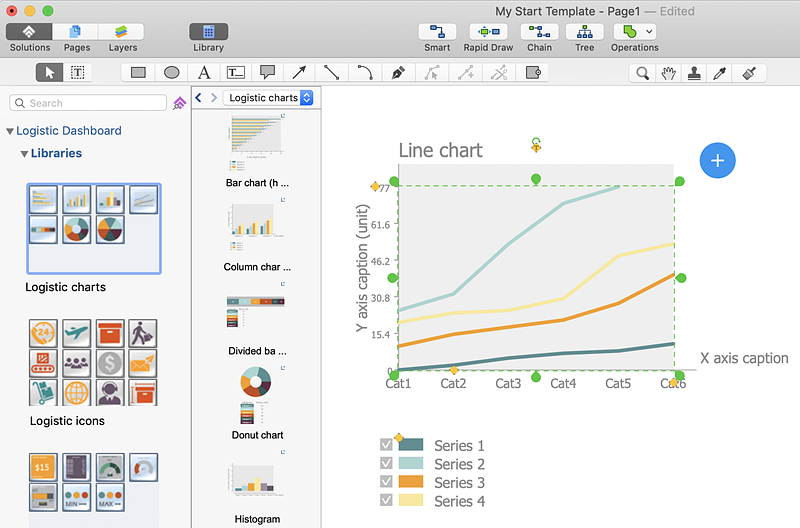
How to Make a Logistic DashboardLogistics deals with a certain sequence of interconnected processes and activities aimed to provide an effective motion of goods from the manufacturer to the consumer. The objectives of logistics management are to ensure the accurate performance of financial, informational, internal and external material flows. Efficient logistics flow requires careful statistics and data awareness. A logistics dashboard provides you with at-a-glance information on the status of your warehouse inventory and supply chain operations so you can respond to challenges before they become issues. ConceptDraw DIAGRAM allows you can easily create a logistics dashboard using Live Objects. The advantage of Live Objects technology is that a live object can be easily connected to a data source to visualize the actual values of any performance metrics. ConceptDraw Logistics Dashboard solution contains a rich library of live charts and indicators.
Result: Now you can monitor all the moving parts of your logistics flow with a real-time dashboard. Logistics visual dashboard shows the actual data from your data source files. The Live Objects will refresh the data every 5 seconds. So as the data updates in one of the data source files, the corresponding Live Object on your dashboard shows the new data within the next 5 seconds. |
How it works:
Useful Solutions and Products:
|
 Visual Dashboards
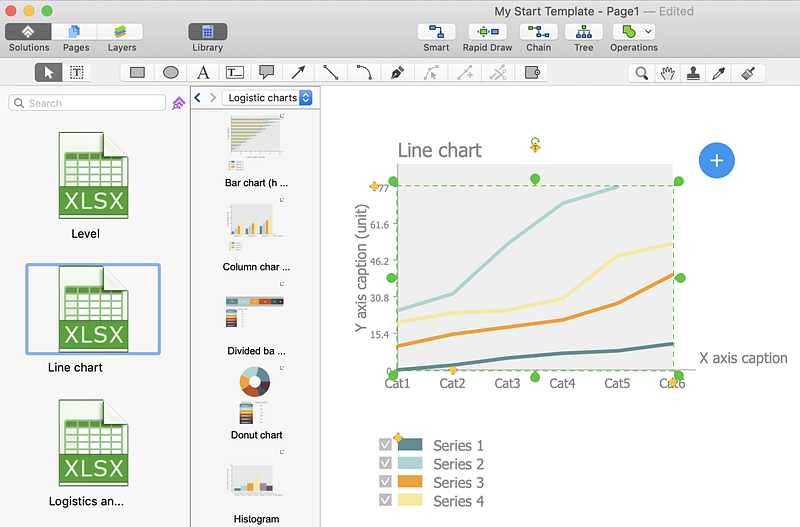
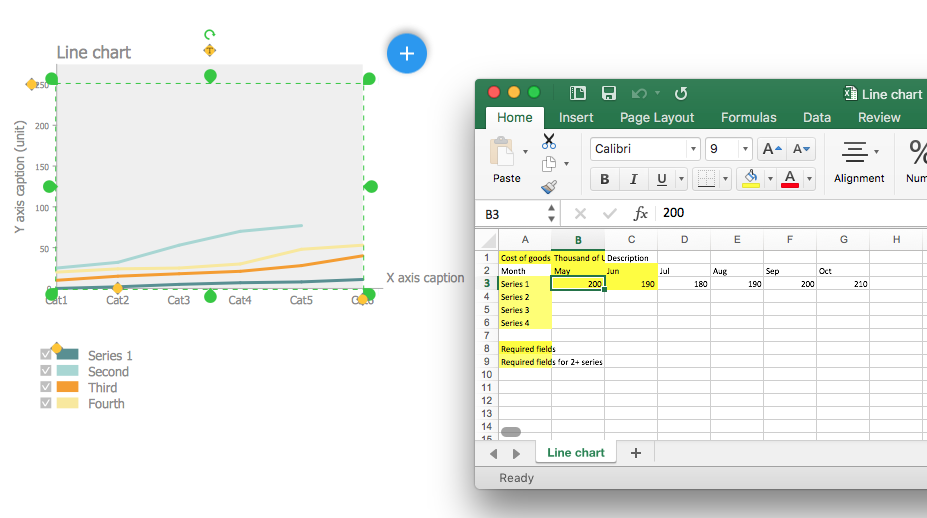
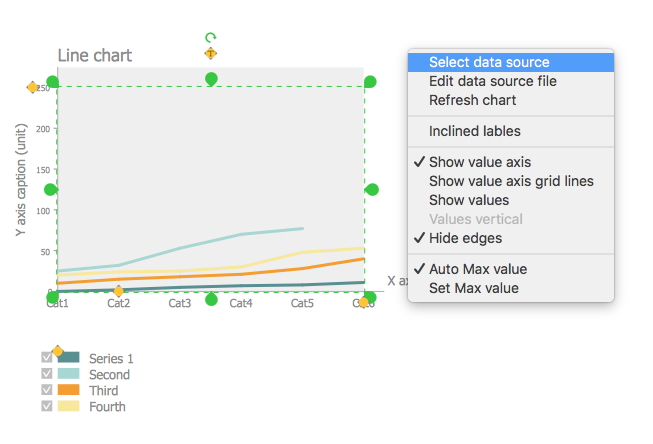
  in the upper right corner of the object. Choose Select Data Source and select your saved data source file.