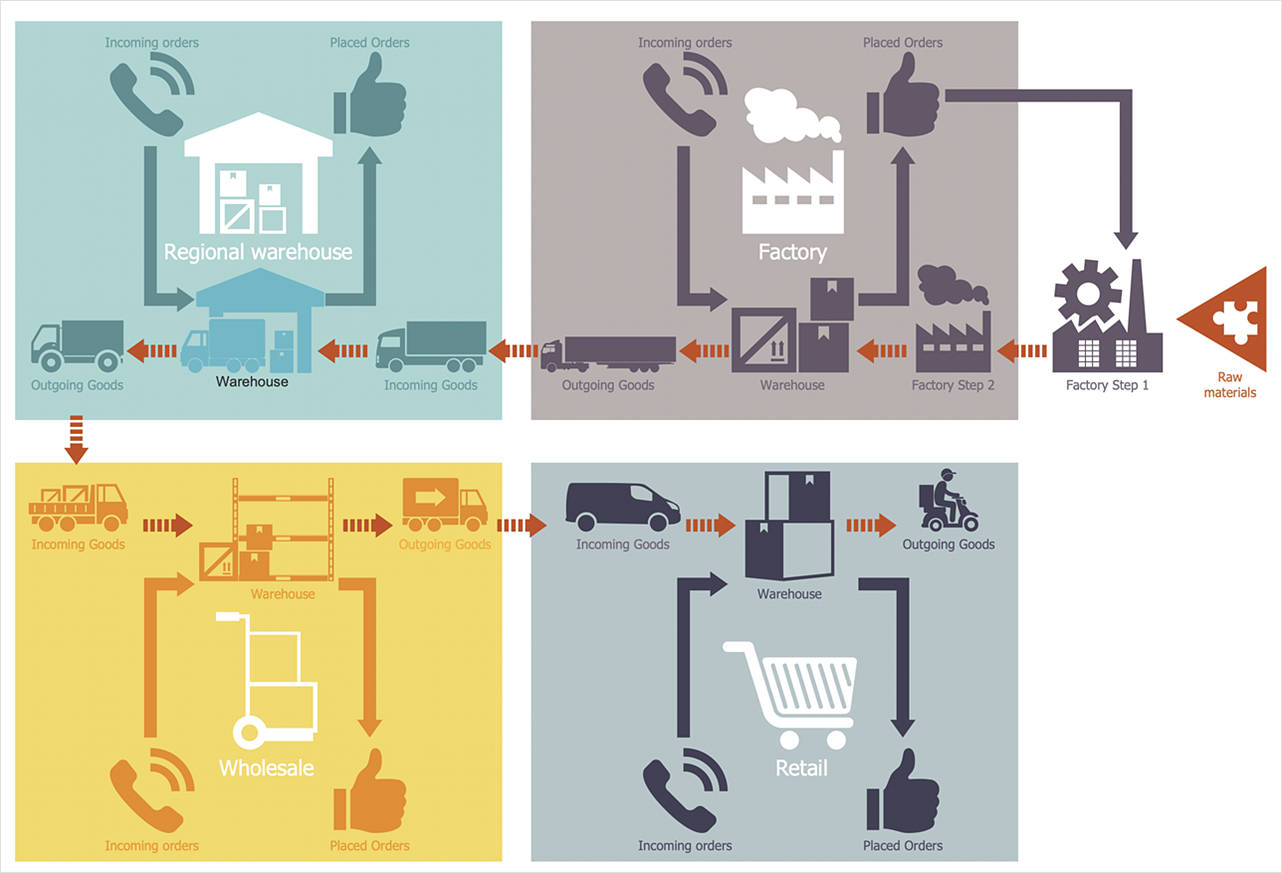
How to Make a Logistics Flow ChartLogistics Flow Charts and Diagrams show the logistics activities and processes of an enterprise, to depict the supply chains, the logistics planning and the stages of moving goods from the seller to buyer. Logistics diagrams are used to define and analyze processes, communicate steps to other people involved in a process and to document a logistic process flow. Moreover, mapping out a company's logistic flows using flowcharts helps to identify the process bottlenecks and show the way for improvements. Logistics Flow Charts are useful tools on rationalization the processes of production, marketing and attendant services within a single enterprise or group of enterprises. They depict Logistics as a flow of inter-related activities: from production to the storage, transportation, and marketing. The ability to create Logistics Flow Charts is delivered in the ConceptDraw Logistics Flow Charts solution. This solution extends ConceptDraw DIAGRAM with a set of 7 stencil libraries containing 262 vector objects that can be used when representing the transferring of data, documents, and tasks during performance of a logistic flow. ConceptDraw DIAGRAM with the extended functionality of the Logistics Flow Charts solution, is the ideal medium for creating designs of this type.


Result: Design with pleasure Inventory and Warehouse flow charts, Logistics process flow diagrams, Warehouse management flow chart, and other Logistics diagrams using the unique tools of Logistics Flow Charts solution. |
How it works:
Useful Solutions and Products:
|
 Business-specific Drawings


