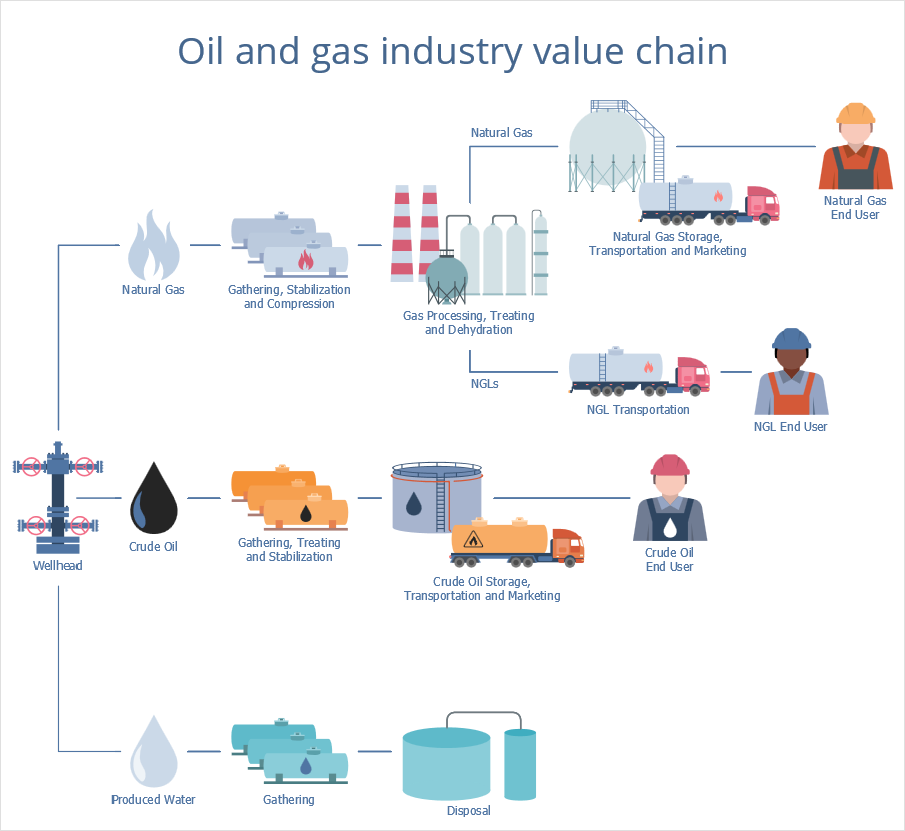
How to Create Oil and Gas InfographicsThis sample shows the steps of the oil and gas industry value chain from the supply source of crude oil and natural gas to the trading mechanisms applied to sell the oil products and gas. The first step for natural gas depicts it's transferring to the point of gathering, stabilization, and compression. The next step is processing, treating, and dehydration. The third includes storage, transportation, and marketing, or just transportation it to the end-user.
The crude oil value chain begins from gathering, treating, and stabilization. Next comes storage, marketing, and finally transportation to the end-user. The information about produced water is also included in this diagram. It is gathered and then disposed of.


Result: The value-chains analysis allows increasing production efficiency and achieving a maximum value for the least possible cost. Any of ConceptDraw’s infographics examples can be used as a good start for your infographics. |
How it works:
Useful Solutions and Products:
|
 Business-specific Drawings