
HelpDesk
Drawing a Pictorial Charts. ConceptDraw HelpDesk
A Pictorial chart is a type of Pictorial Infographics. It is used to visually present data comparison. Pictorial charts use relative sizes or repetitions of the same icon ,")
Sample Pictorial Chart . Sample infographics
Sample Pictorial Chart — Small Business Statistics (UK 2013)
 Picture Graphs Solution. ConceptDraw.com
What is a Picture Graph ? A Picture Graph (Image Chart , Pictorial Chart ) is the
type of a Bar Graph , which visualizes data and represents values in various

Process Flowchart - Draw Process Flow Diagrams by Starting with
Whether you need to make process flow diagram for single unit or multiple units (which do not include detailed information and are known as the schematic flow diagrams or block flow diagrams) you can draw it in ConceptDraw PRO with help of already existing examples. Process Flowcharts are usually being used for displaying the relations between main parts of same system. Create your own flow model that analyses and illustrates all of activities happening during your product or service making! A variety of professional flowchart symbols, smart connectors, drawing tools and shape libraries are available for your use to create flowcharts of complex processes, procedures and information exchange. Define, sort and document basic work and data flows, quality, financial, production management processes making different kinds of flowcharts, process flow models, data flow or SDL diagrams in a perfect business tool ConceptDraw PRO to increase efficiency and productivity of your business!

HelpDesk
Create a Picture Graph . ConceptDraw HelpDesk
A Picture Graph is simple kind of marketing diagram used to show the relationship among various quantities. It include pictures or symbols to representThe vector stencils library "Picture Graphs " contains 35 templates of picture bar
graphs for visual data comparison and time series. Drag a template from the
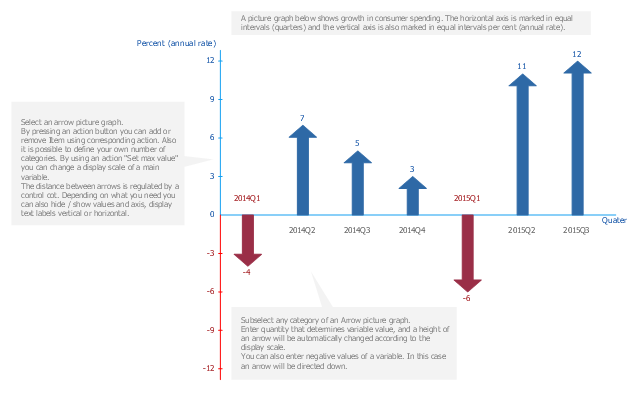
A picture chart (image chart , pictorial graph ) is the type of a bar graph visualizing
numarical data using symbols and pictograms. In the field of economics and

The vector stencils library "Picture bar graphs " contains 35 templates of pictorial
charts . Use it for visualization of data comparison and time series with
 Fishbone Diagrams Solution. ConceptDraw.com
The Fishbone Diagram (also called Ishikawa Diagram , Cause and Effect . This
model is presented in diagram form by using a fishbone diagram — also known
- Design elements - Picture bar graphs | Picture Graphs | Picture ...
- Picture Graphs | What Is a Picture Graph ? | Pictures of Graphs ...
- Pictorial Graph Example
- 4 Level pyramid model diagram - Information systems types ...
- Business Model Example Diagram
- Sample Pictorial Chart . Sample Infographics | Picture Graphs ...
- History Of Pictorial Graph
- Organizational Charts | Pictorial Graph Disease Related
- Pyramid Diagram and Pyramid Chart | Circle Spoke Diagram ...
- Pyramid Diagram | Process Flowchart | Pyramid Diagram | Chart Of ...