Sales Growth. Bar Graphs Example, Column Chart Example
Sales Growth. Bar Graphs ExampleSales Process Flowchart
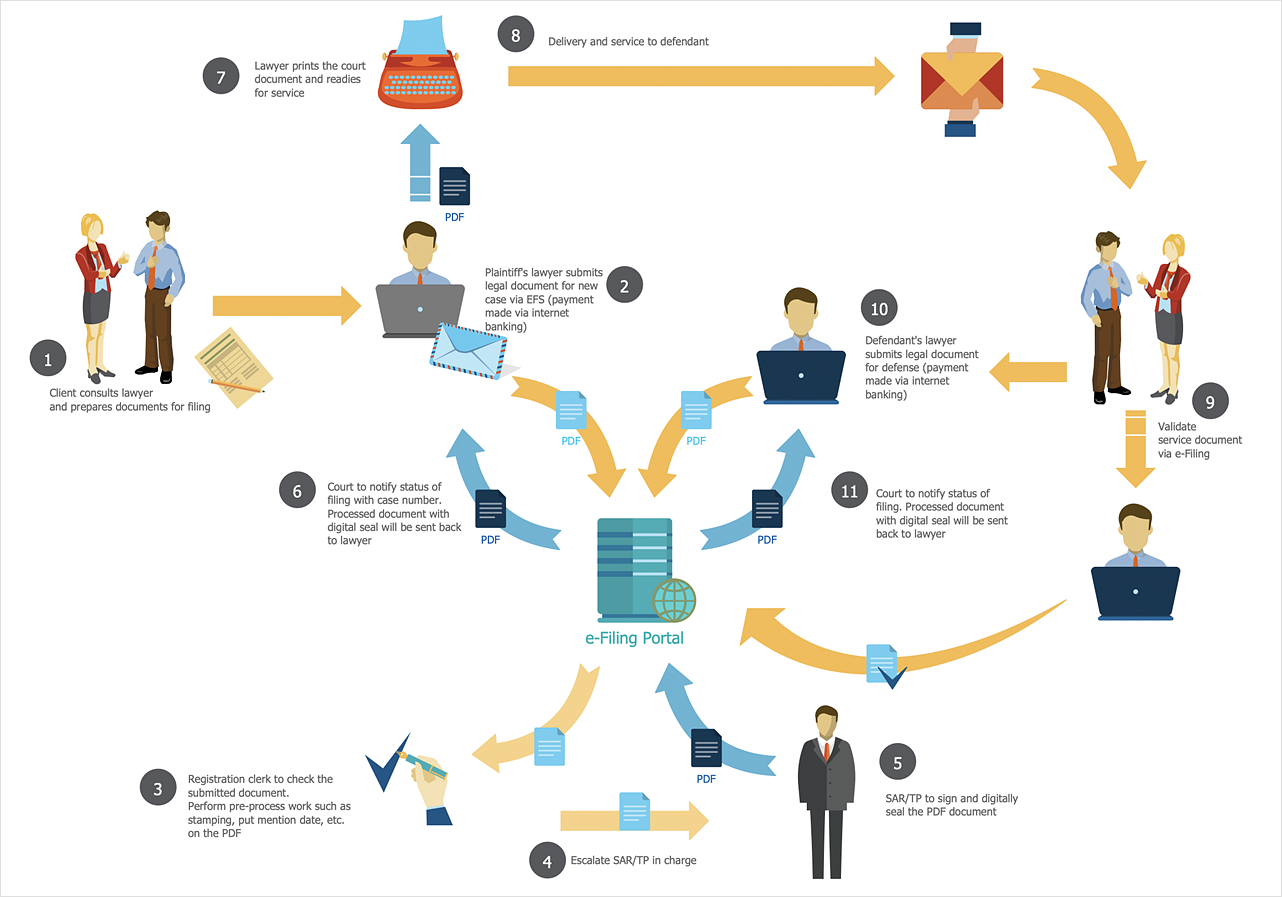
Analyzing the sales processing working in some business selling any kinds of products, you always want to control these processes and to do it is better illustrating the market and the relations happening in it. Being market-oriented and always keep pace with the time can help you to succeed in case you do everything just right and check on the receivables and accounts payable balance on time not to miss the right moment when you can invest more money in terms of getting more profit or stop supporting business in order to start something else, for example. To be successful and to have stable income is easy as long as you use the right tools for making your decisions on time. One of these tools can be software which can allow you to create any diagram or plan as well as sales process flowchart in shot terms using pre-designed layouts and samples to make your own charts looking professional, sophisticated and smart. Once you download the software itself as well as the application called ConceptDraw STORE, you can find examples there very helpful and useful as well as lots of different symbols for making any diagram look like if someone experienced made it.HelpDesk
Creating a Sales Flowchart. ConceptDraw HelpDesk
A sales flowchart is a specialized type of flowchart. The ability to create sales flowcharts is contained in the ConceptDraw Sales Flowcharts solution.
 Sales Flowcharts Solution. ConceptDraw.com
Sales Flowcharts. A person or an organization that expresses an interest in
acquiring the previously offered item of value can be referred to as a potential
buyer.
The Facts and KPIs. Visualizing Sales Data. To See How Your
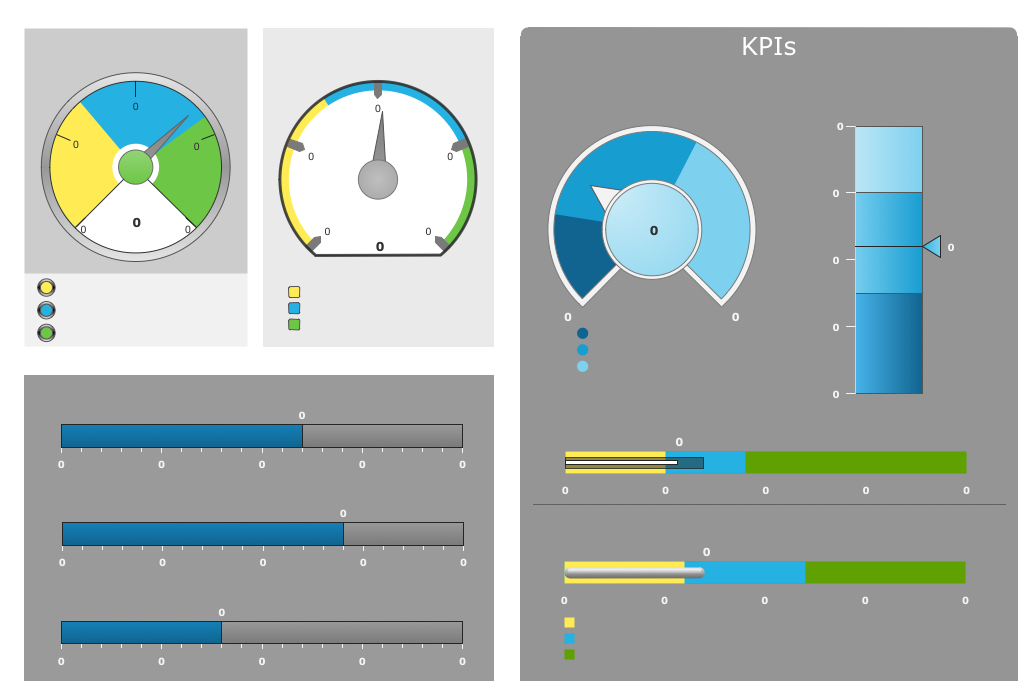
Sales KPIs Dashboard SampleMarketing and Sales Organization chart
Working in marketing if it is internet one or for some supermarket making people shopping with pleasure enjoying their final choice, it is always important to have the professional tools for succeeding in what you do and one of these tools can be the professional software for marketers such as ConceptDraw DIAGRAM which can be used for creating the diagrams and flowcharts as well as organization charts and describing the desired sales process in a way of marketing plan. Having our software which contains so many templates and samples for making any kind of scheme, diagram and plan means having the right thing to simplify your work and your life making anything you need in a short terms and having the result of it looking very professional. Moreover, after finishing making what was planned to be made, you can always save, convert or review your document in any of these formats: image, PDF file, HTML, MS Visio, MS PowerPoint Presentation or Adobe Flash.Sales Flowchart Symbols. Color-Coded Flowchart Symbols
Sales Process Flowchart Symbols, sales process flow diagram, red green blue colored flowchart symbolsSales Dashboard Template. Visualizing Sales Data. To See How
Sales KPIs Dashboard SampleSales Dashboard - Access Anywhere. To See How Your Business
Sales Dashboard - Design Elements icons software diagraming tools macHelpDesk
Creating Interactive Sale Dashboard. ConceptDraw HelpDesk
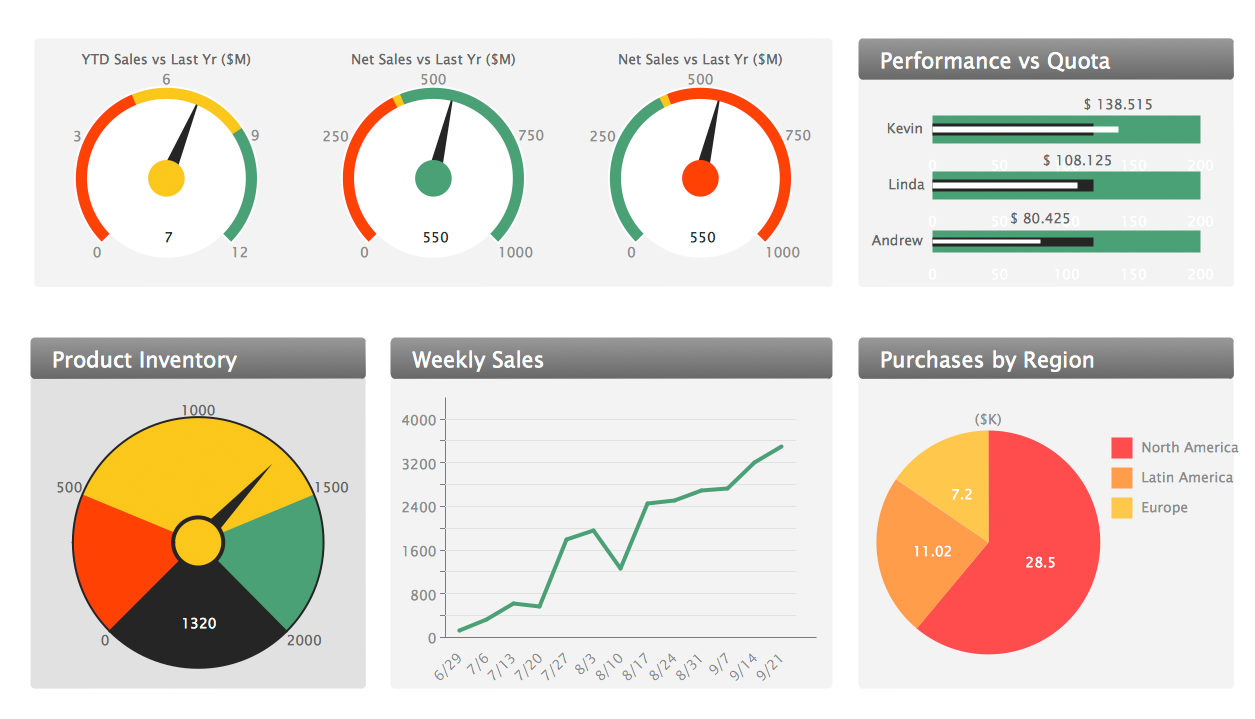
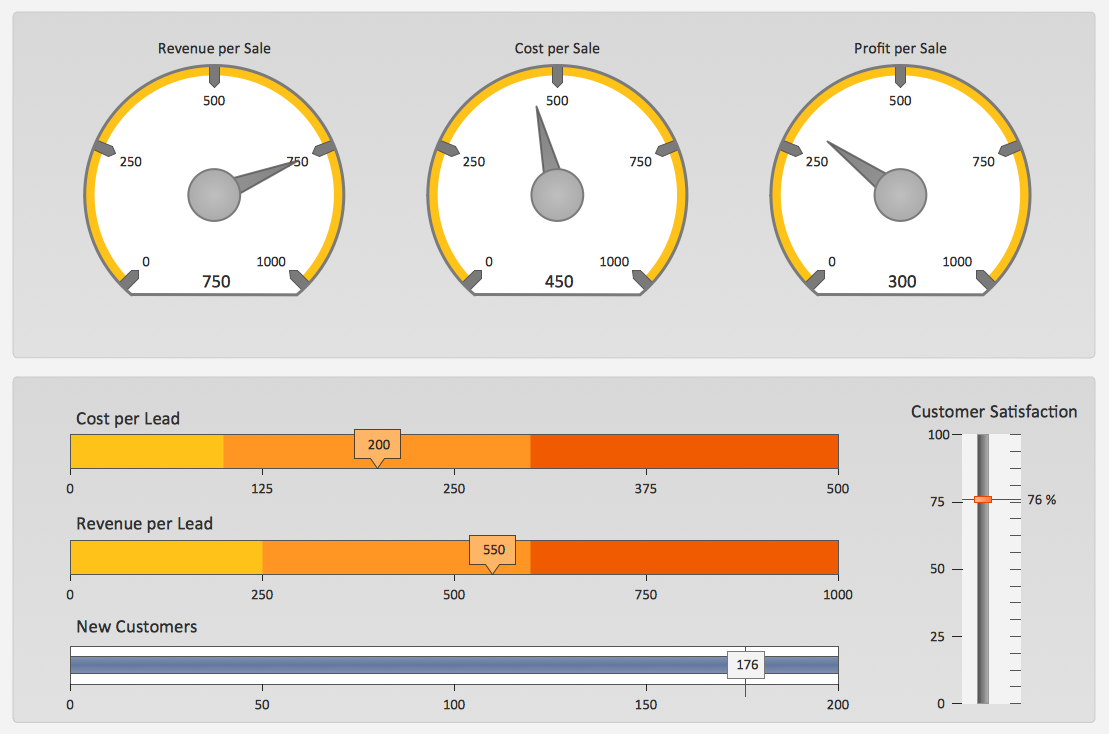
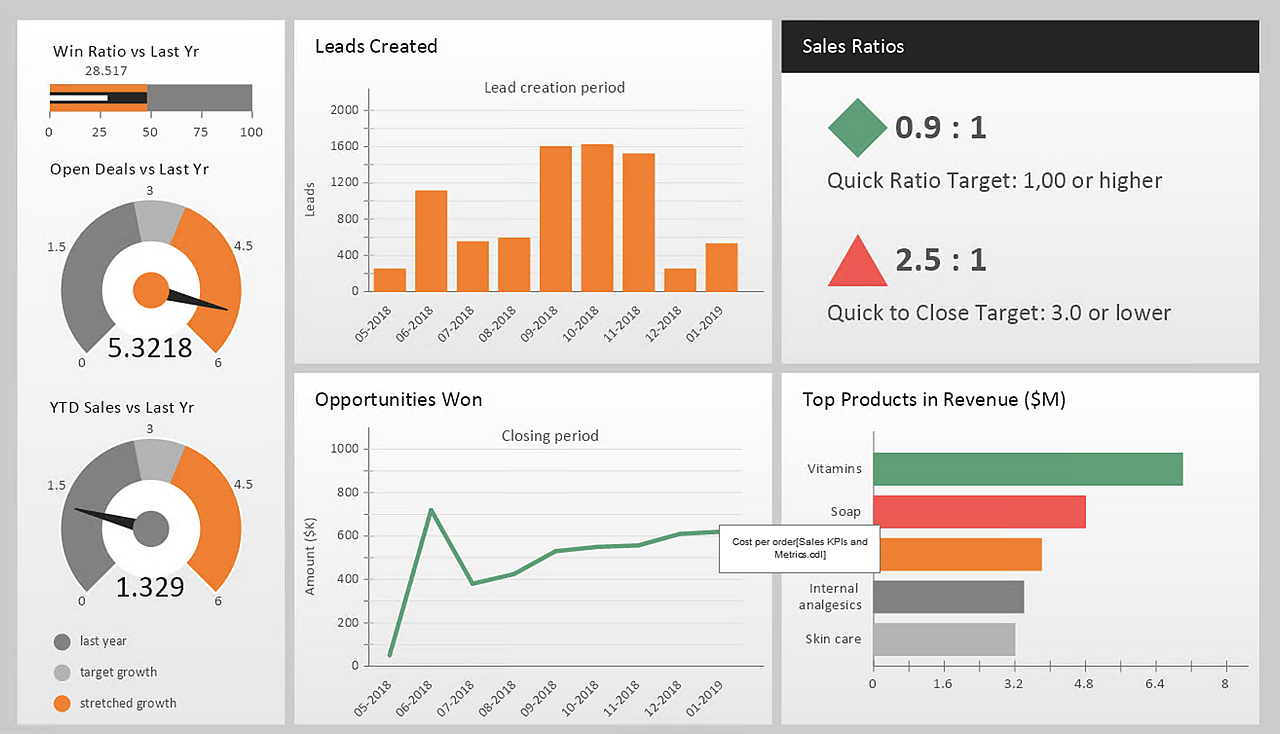
A visual dashboard is a valuable tool for any sales team. Sales dashboard allows you to view and monitor sales indicators that are important for manager and
 Sales Dashboard Solution. ConceptDraw.com
Sales Dashboard solution extends ConceptDraw DIAGRAM software with
templates, samples and library of vector stencils for drawing the visual
dashboards of
Sales Dashboards for Your Company. To See How Your Business
Sales KPIs Dashboard Sample- New Sales Flowcharts Solution Now Available for ConceptDraw ...
- Sales Process Flowchart. Flowchart Examples | Introduction to ...
- Sales Process Flowchart. Flowchart Examples | Sales Process ...
- Business Process Diagrams | Fishbone Diagram | Rapid UML ...
- SWOT Analysis | Sales Teams are Inherently Competitive | SWOT ...
- Sales Process Flowchart. Flowchart Examples | Structured Systems ...
- Sales Process Flowcharts | Sales Flowcharts | Accounting Flowchart ...
- The Sales Process | Entity-Relationship Diagram (ERD) with ...
- Entity Relationship Diagram For Product Sales Management
- Logistics Flow Charts | Sales Process Flowchart Symbols | Sales ...
- Examples Er Diagram Of Sales Department
- Sales workflow - Vector stencils library
- Land sales process flowchart
- Sales workflow - Vector stencils library
- Sales KPIs and Metrics - Vector stencils library
- Design elements - Sales workflow
- Sales Strategy Diagram
- New Sales Dashboard Solution for ConceptDraw PRO v9
- Sales KPIs - Performance dashboard
- Fishbone Diagrams | Sales KPI Dashboards | PROBLEM ANALYSIS ...


