Conduct Stakeholder Analysis with ConceptDrawﺡ Onionﺡ Diagramsﺡ Solution
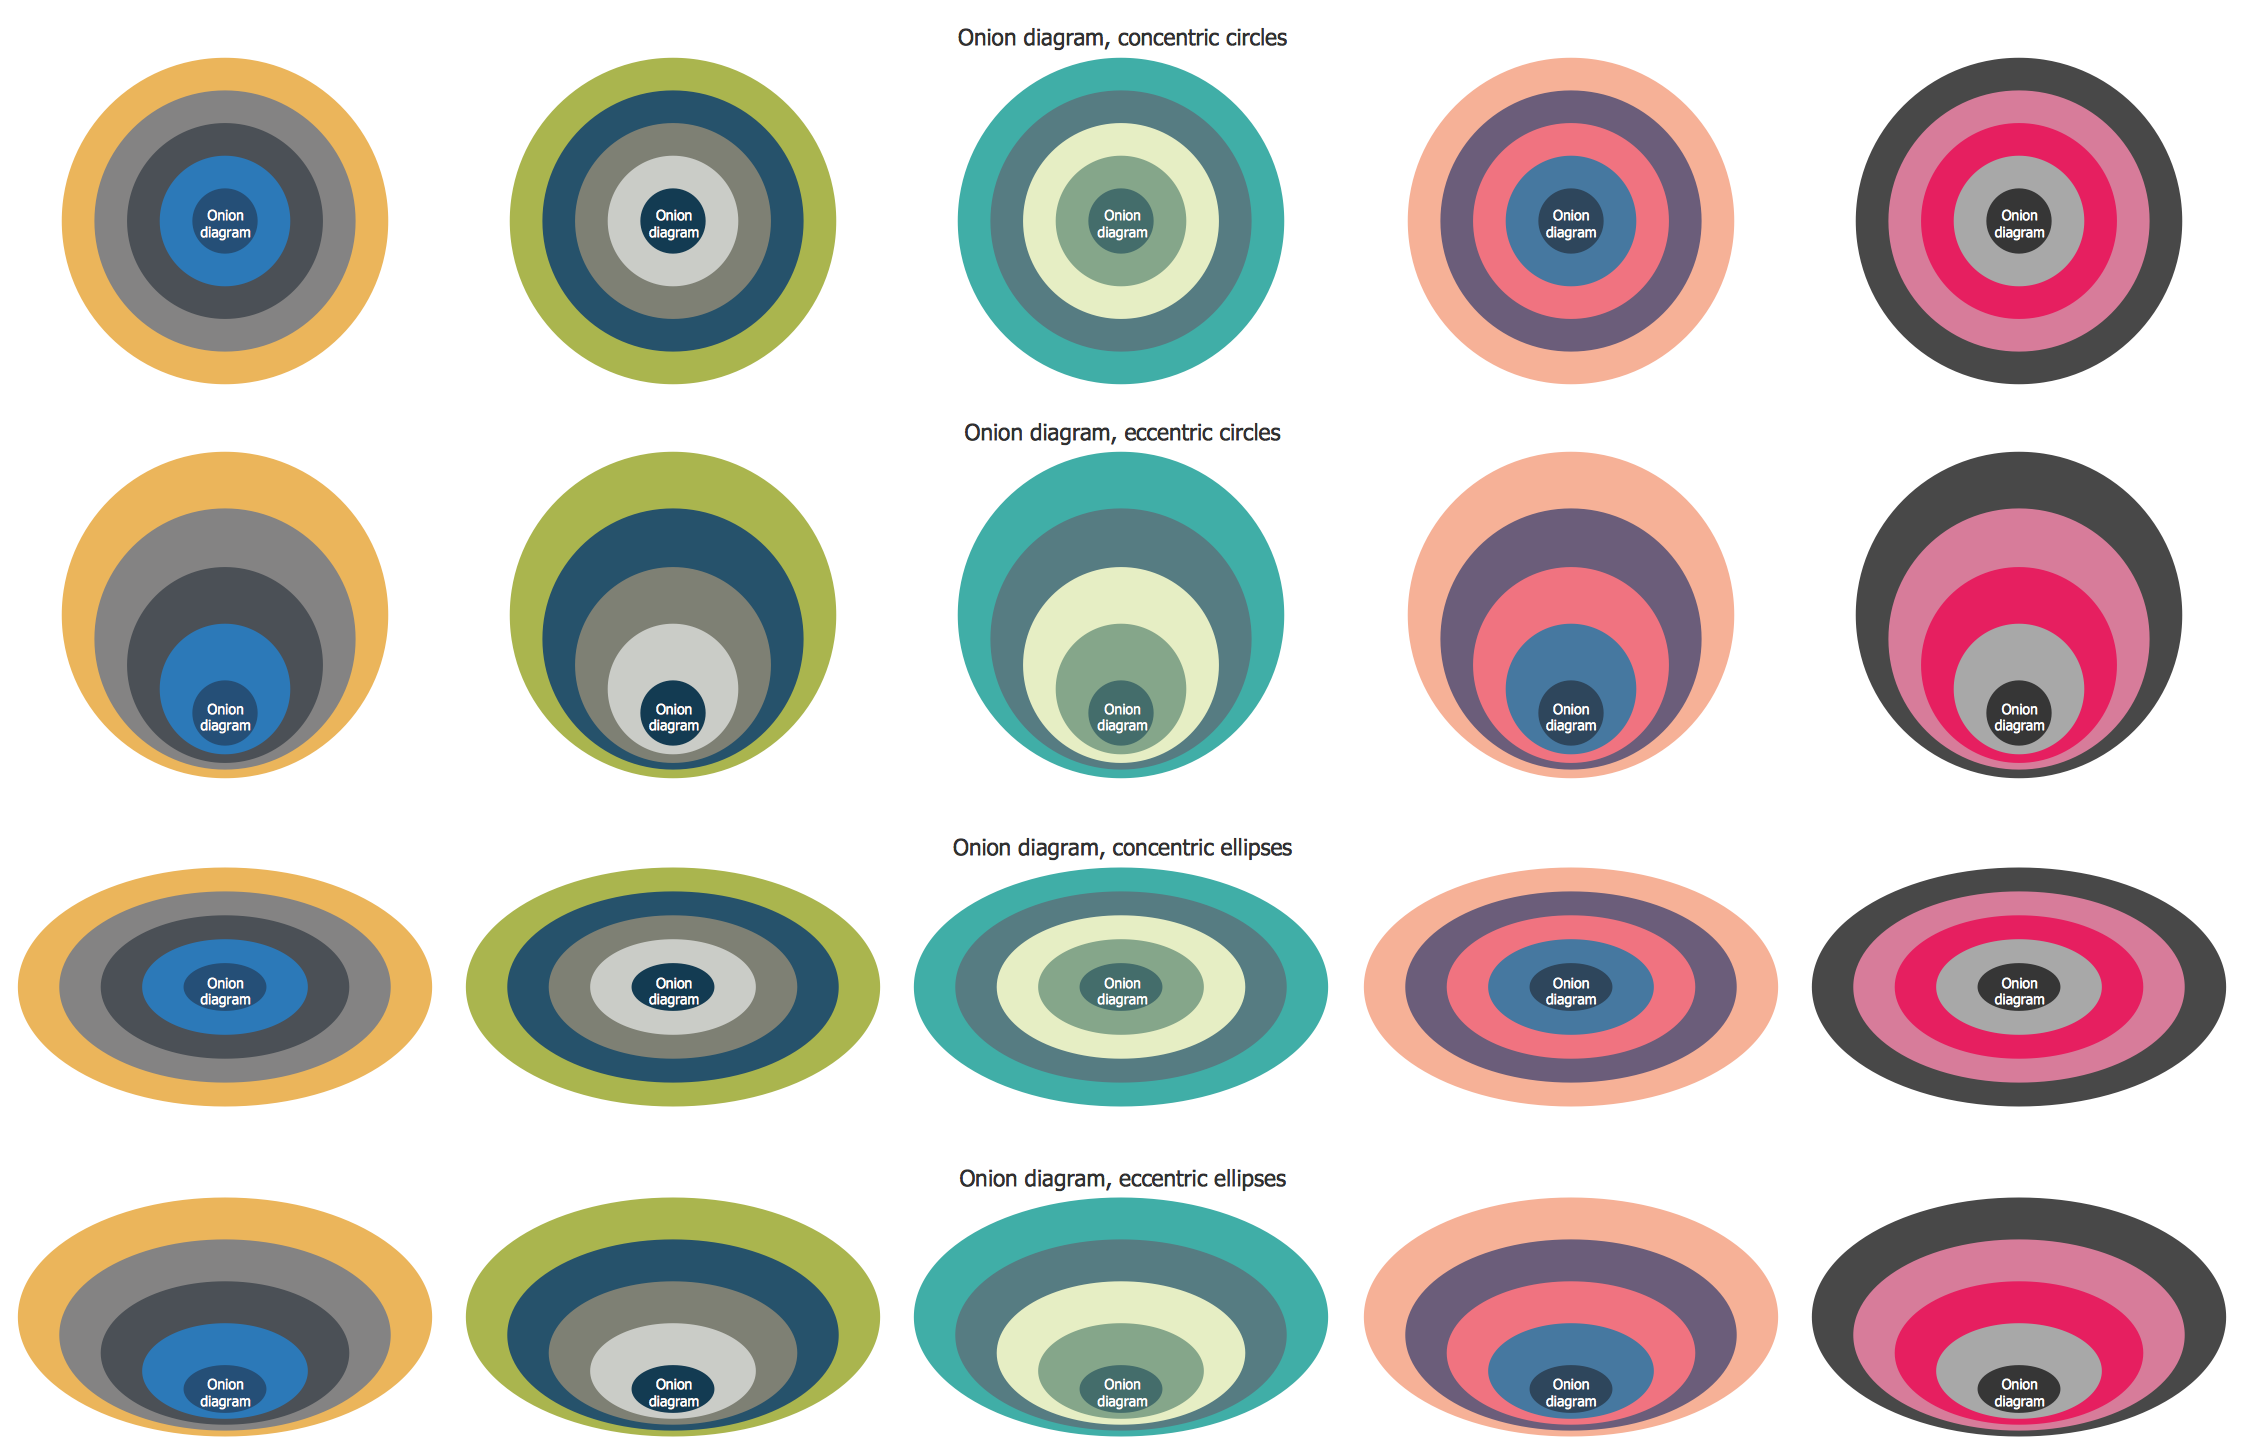
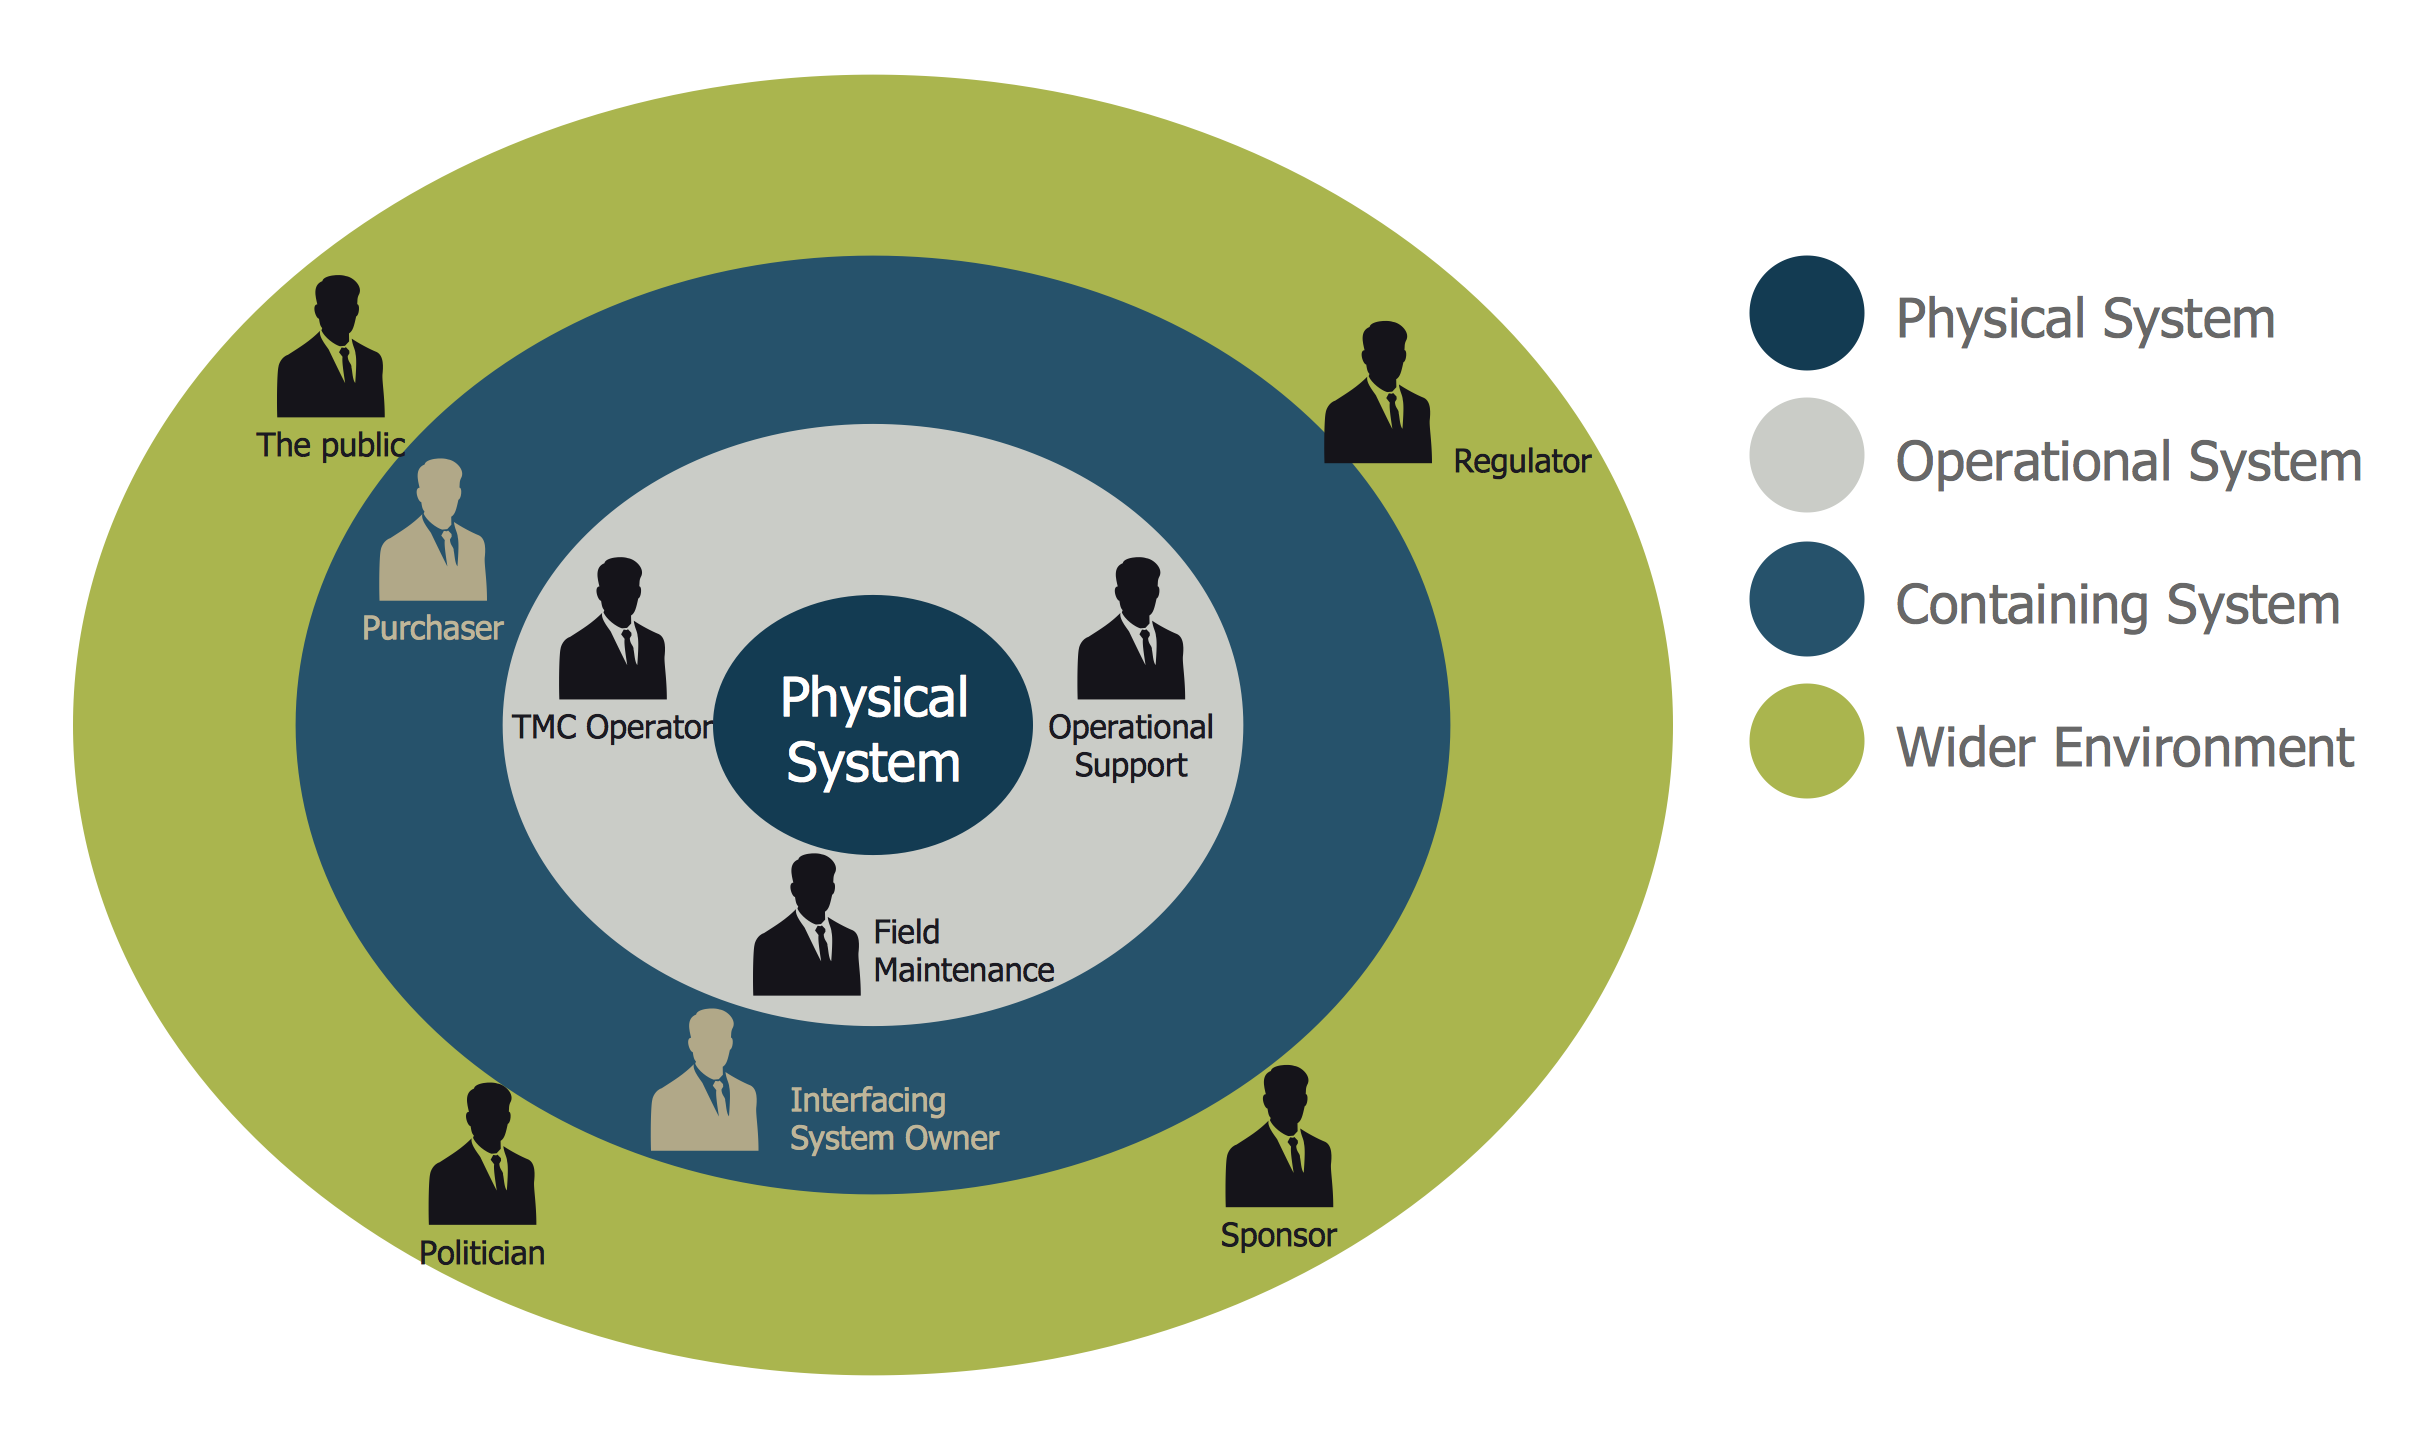
The Stakeholder Onion Diagram is often used as a way to view the relationships of stakeholders to a project goal. The new solution for ConceptDraw PRO v10 is great for displaying the relationships that exist in a project. The primary difference that separates the onion diagram from other types of project oriented diagrams is the focus on the project goal. Most other diagram styles focus on the other variables such as stakeholders or timeline. Stakeholder Onion Diagrams usually consist of 4+ layers. The center of the diagram represents the product/solution; each subsequent layer has additional project data demonstrating the relationships that exist in a project environment.

There are no hard fast rules on what must or must not be contained in the stakeholder diagram. The key value of the Stakeholder Onion Diagram is to show the relationships that lead to a successful final product or deliverable. The Stakeholder Onion Diagram is intended to map out how projects are impacted by influence, support, or other KPI project metrics. The Stakeholder Onion Diagram is a paid solution ($49 USD) for ConceptDraw PRO v10.

ConceptDraw PRO is

