Samples / Quality Management
Quality Management
This is the Quality Management area from ConceptDraw.com Samples section.
Quality diagrams and mind maps are graphic communication tools for quality management.
The Quality Management area solutions contain vector stencils and templates for drawing quality diagrams and mind maps:
- Seven Basic Tools of Quality — vector stencils and templates for drawing: cause-and-effect (fishbone, Ishikawa) diagrams, check sheets, control charts, histograms, Pareto charts, process flowcharts, run charts, scatterplots, stratification diagrams;
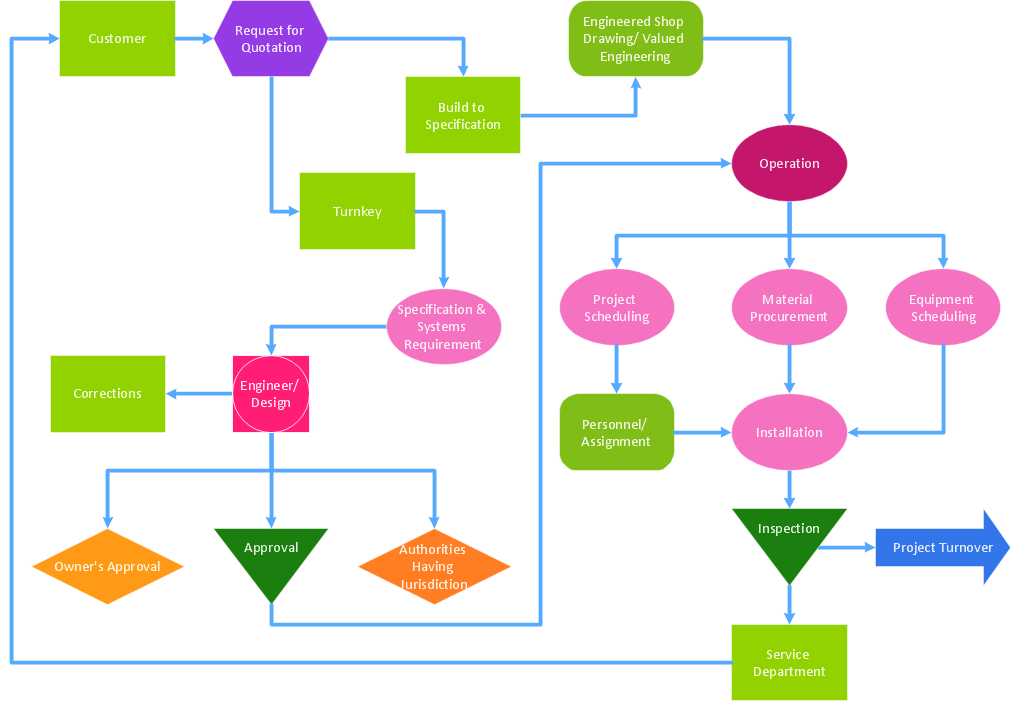
- Total Quality Management (TQM) diagrams — tools for drawing TQM flowcharts;
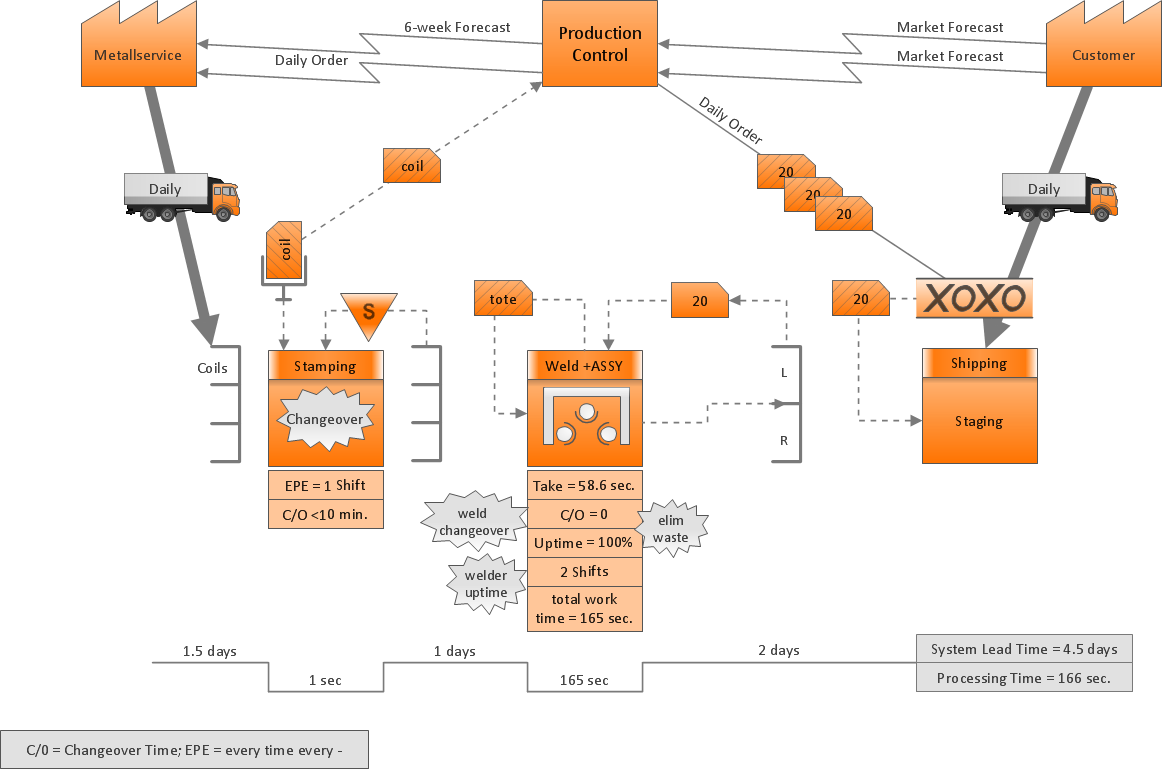
- Value Stream Mapping — tools for drawing value stream maps (VSM);
- Quality Mind Map — tools for drawing quality presentation, slideshow mind maps, quality meeting agenda mind maps, quality problem solving mind maps.
- House of Quality - set of ready-to-use templates and vector design elements of House of Quality shapes and symbols,
ConceptDraw Solution Park also contains additional solutions for the quality management components — quality planning, quality assurance, quality control, quality improvement:
- solutions from the Graphs and Charts area — tools for visualization of quality management quantitative and statistic data;
- solutions from the Dashboards area — tools for visual monitoring quality management business metrics and key performance indicators (KPIs);
- Seven Management and Planning Tools from the Management area — vector stencils and templates for drawing diagrams of seven new quality control tools.
This web page navigates you to the diagram and mind map samples from the Quality Management area solutions.


