Samples / Statistical Charts / Picture Graphs
Picture Graphs
Samples of picture graphs (image charts, pictorial charts) are created using ConceptDraw DIAGRAM diagramming and vector drawing software and the Picture Graphs solution.
ConceptDraw DIAGRAM provides export of vector graphic multipage documents into multiple file formats: vector graphics (SVG, EMF, EPS), bitmap graphics (PNG, JPEG, GIF, BMP, TIFF), web documents (HTML, PDF), PowerPoint presentations (PPT), Adobe Flash (SWF).
Tutorials and Solutions:
Video Tutorials: ConceptDraw Solution Park
Solutions: Picture graphs for ConceptDraw DIAGRAM
Sample 1: Picture Graph — Population Growth by Continent, 2010 - 2013
Picture graph sample:Population growth by continent, 2010 - 2013.
This sample was created in ConceptDraw DIAGRAM using the

Sample 2: 2007 Top 10 Countries by Military Expenditure PPP
Picture graph sample: 2007 top 10 countries by military expenditure PPP.
This sample was created in ConceptDraw DIAGRAM using the

Sample 3: A Graph to Show the Increase in Subscibers on YouTube to Anonymous' Videos
Picture graph sample: A graph to show the increase in subscibers on YouTube to anonymous' videos.
This sample was created in ConceptDraw DIAGRAM using the

Sample 4: Baby Population
Picture graph sample: Baby population.
This sample was created in ConceptDraw DIAGRAM using the

Sample 5: Academic Costs for Residents, 2015 - 16
Picture graph sample: Academic Costs for Residents, 2015 - 16.
This sample was created in ConceptDraw DIAGRAM using the

Sample 6: Average Energy Prices for Manufacturers
Picture graph sample: Average Energy Prices for Manufacturers.
This sample was created in ConceptDraw DIAGRAM using the

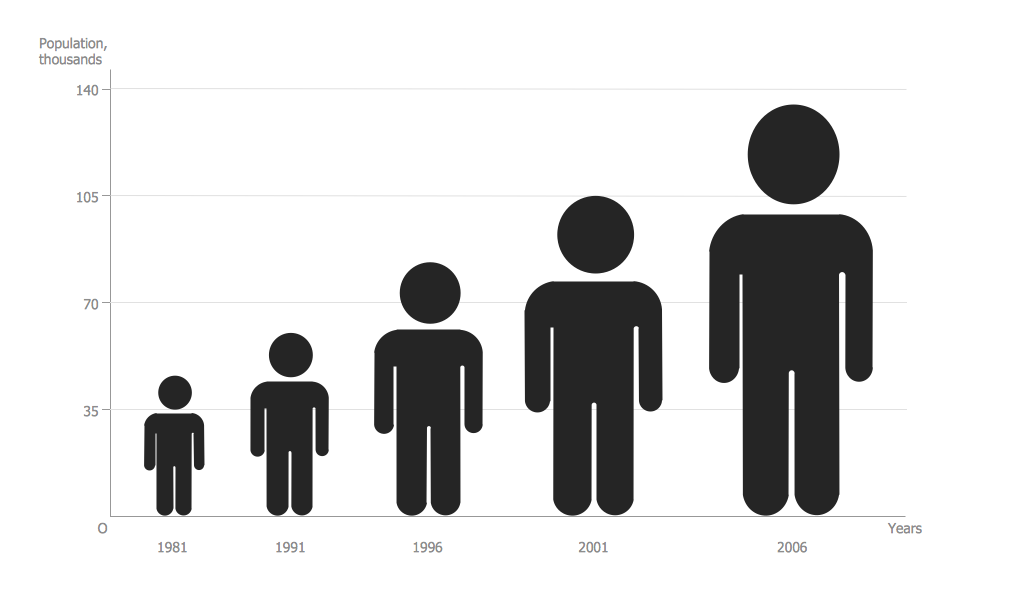
Sample 7: Barrie Population
Picture graph sample: Barrie Population.
This sample was created in ConceptDraw DIAGRAM using the

Sample 8: Cities with the Most Skyscrapers
Picture graph sample: Cities with the Most Skyscrapers.
This sample was created in ConceptDraw DIAGRAM using the

Sample 9: Computer and Internet Use at Home Over Time
Picture graph sample: Computer and Internet Use at Home Over Time.
This sample was created in ConceptDraw DIAGRAM using the

Sample 10: Manufacturing in America
Picture graph sample: Manufacturing in America.
This sample was created in ConceptDraw DIAGRAM using the

Sample 11: Peru Wheat Area and Production
Picture graph sample: Peru Wheat Area and Production.
This sample was created in ConceptDraw DIAGRAM using the

Sample 12: Production of Biofuels
Picture graph sample: Production of Biofuels.
This sample was created in ConceptDraw DIAGRAM using the

Sample 13: Regional Population Growth from 2010 to 2016
Picture graph sample: Regional Population Growth from 2010 to 2016.
This sample was created in ConceptDraw DIAGRAM using the

Sample 14: Unemployment Rates of Persons 25 Years Old and Over
Picture graph sample: Unemployment Rates of Persons 25 Years Old and Over.
This sample was created in ConceptDraw DIAGRAM using the

All samples are copyrighted CS Odessa's.
Usage of them is covered by Creative Commons “Attribution Non-Commercial No Derivatives” License.
The text you can find at: https://creativecommons.org/licenses/by-nc-nd/3.0