
Example 1. Bank Sequence Diagram in ConceptDraw DIAGRAM /p>
ATM UML Diagrams Solution provides 14 libraries with 182 vector objects for easy design Bank UML Diagrams of any type, including Bank Sequence Diagram.

Example 2. Bank UML Sequence Diagram Library Design Elements
Use of ready predesigned objects is the fastest way of drawing. It is a Bank UML Sequence Diagram library from ATM UML Diagrams Solution which is specially intended for drawing Bank Sequence Diagram.

Example 3. Bank Sequence Diagram
This sample was created in ConceptDraw DIAGRAM using the predesigned objects from the Bank UML Sequence Diagram library of ATM UML Diagrams Solution. It shows the interactions and transactions between customers, ATM and bank on the Bank Sequence Diagram. An experienced user spent 10 minutes creating this sample, it is included in ATM UML Diagrams Solution and available from ConceptDraw STORE.
Use the ATM UML Diagrams Solution for ConceptDraw DIAGRAM software to create your own professional looking Bank Sequence Diagram of any complexity quick, easy and effective.
All source documents are vector graphic documents. They are available for reviewing, modifying, or converting to a variety of formats (PDF file, MS PowerPoint, MS Visio, and many other graphic formats) from the ConceptDraw STORE. The ATM UML Diagrams Solution is available for all ConceptDraw DIAGRAM users.
TEN RELATED HOW TO's:
While creating flowcharts and process flow diagrams, you should use special objects to define different statements, so anyone aware of flowcharts can get your scheme right. There is a short and an extended list of basic flowchart symbols and their meaning. Basic flowchart symbols include terminator objects, rectangles for describing steps of a process, diamonds representing appearing conditions and questions and parallelograms to show incoming data.
This diagram gives a general review of the standard symbols that are used when creating flowcharts and process flow diagrams. The practice of using a set of standard flowchart symbols was admitted in order to make flowcharts and other process flow diagrams created by any person properly understandable by other people. The flowchart symbols depict different kinds of actions and phases in a process. The sequence of the actions, and the relationships between them are shown by special lines and arrows. There are a large number of flowchart symbols. Which of them can be used in the particular diagram depends on its type. For instance, some symbols used in data flow diagrams usually are not used in the process flowcharts. Business process system use exactly these flowchart symbols.
Picture: Flowchart Symbols: Meaning and Examples
Related Solution:
Steps in the Accounting Process - The Accounting Process is a sequence of organization activities that is used for gaining quantitative information about the finances. This complex process consists of a set of sequential steps.
9 steps in the accounting process: Analysis of Business Transactions, Make Journal Entries, Post to Ledger Accounts, Prepare Trial Balance, Make Adjusting Entries, Adjusted Trial Balance, Prepare Financial Statements, Close Accounts, Post-Closing Trial Balance.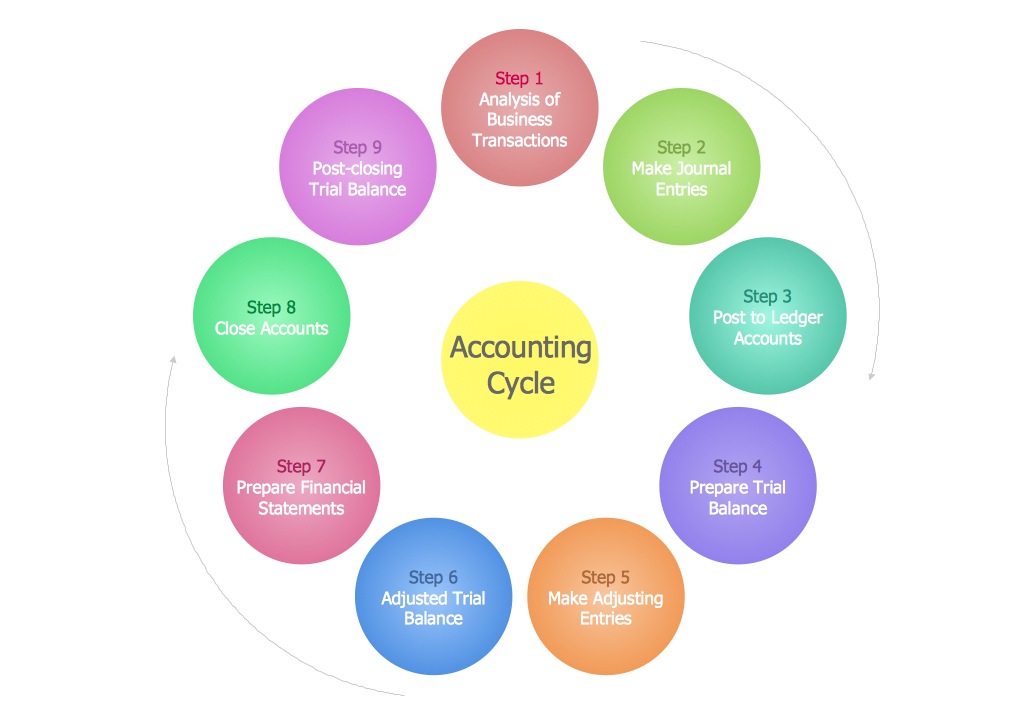
Picture: Steps in the Accounting Process
Related Solution:
UML Class Diagrams is a type of static structure diagram that is used both for general conceptual modeling of the systematics of the application, and for detailed modeling translating the models into programming code. It describes the structure of a system by showing the: classes of a system, attributes, operations, and the relationships between them.
The Rapid UML Solution for ConceptDraw DIAGRAM includes the UML Class Diagram library that helps you to design the UML Class Diagram quick and easy. You can simply and quickly drop the ready-to-use objects from the library into your document to create the UML Class Diagram.
Picture: UML Class Diagram Constructor
Related Solution:
Social media is a popular view of mass communication which allows people, companies and organizations create, share, discover, modify, access, comment, discuss and exchange information through the Internet. Social Media Response solution for ConceptDraw DIAGRAM provides collection of 10 libraries with diversity of predesigned vector social media flowchart symbols for fast and easy creating interactive Social Media Flowcharts, Response Charts and Action Mind Maps.
Picture: Social Media Flowchart Symbols
Related Solution:
Visual information is easier to perceive. You can teach even a child to make diagrams with a good flowchart example that would be interesting for it. Flowcharts can be fun, it’s not about business processes or programming algorithms.
This flowchart shows step by step process of manufacturing of Nixtamal The product which is obtained by processing maize with calcium hydroxide. We must assume that the Aztecs were very fond of this product, if the recipe of its production came to our times. This flow chart was designed using ConceptDraw DIAGRAM with its solution for designing flowcharts of various types, sizes and purposes. ConceptDraw Flowcharts solution consists from the library of flowchart symbols, containing the set vector objects. Also there are a lot of diverse templates and samples of flow charts.
Picture: Flowchart Examples and Templates
Related Solution:
ConceptDraw DIAGRAM is a powerful diagramming and vector drawing software. Extended with School and Training Plans Solution from the Building Plans Area it became the best software for quick and easy designing various School Floor Plans.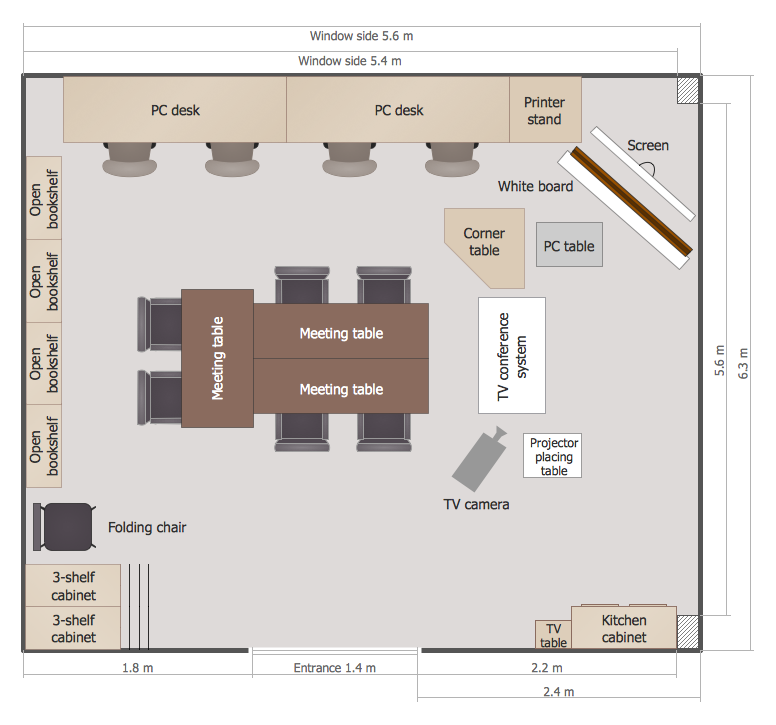
Picture: School Floor Plans
Related Solution:
ConceptDraw DIAGRAM is the world’s premier cross-platform business-diagramming tool. Many, who are looking for an alternative to Visio, are pleasantly surprised with how well they can integrate ConceptDraw DIAGRAM into their existing processes. With tens of thousands of template objects, and an easy method for importing vital custom objects from existing Visio documents, ConceptDraw DIAGRAM is a powerful tool for making extremely detailed diagrams, quickly and easily.
Picture: ConceptDraw DIAGRAM : Able to Leap Tall Buildings in a Single Bound
Related Solution:
UML Communication diagramming software with rich examples and template. ConceptDraw is ideal for software designers and software developers who need to draw UML Communication Diagrams.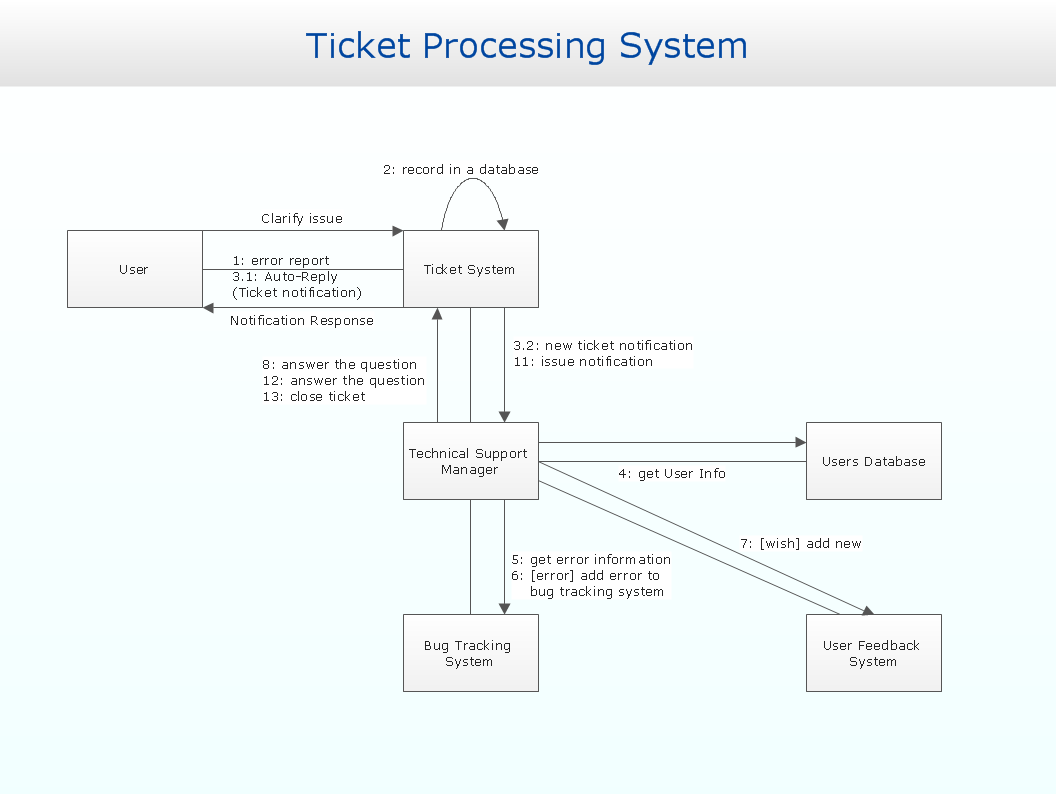
Picture: Communication Diagram UML2.0 / Collaboration UML1.x
This action mindmap helps to develop good customer references and user success stories.
Picture: Bank Customer Positive Feedback
Related Solution:
Use case diagrams are used at the development of software and systems for definition of functional system requirements or system of systems. Use case diagram presents the consecution of object’s actions (user’s or system’s) which are executed for reaching the definite result.
Picture: Use Case Diagrams technology with ConceptDraw DIAGRAM

