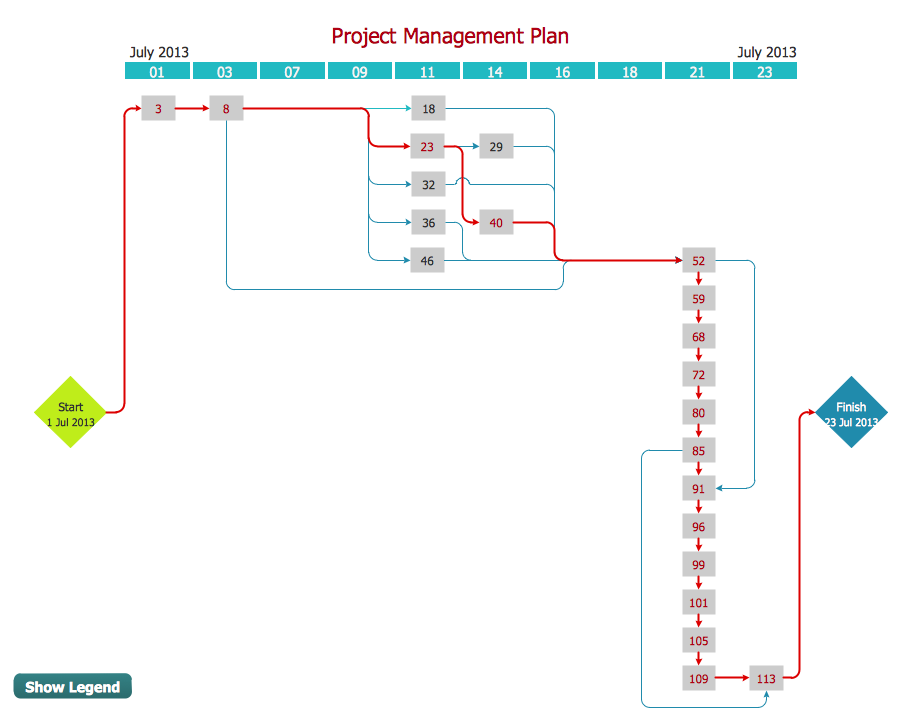
Example 1. PERT Chart — Project Management
PERT Chart is one of the most commonly used tools from the set of Seven Management and Planning Tools. We are glad to offer the powerful ConceptDraw DIAGRAM software which can effectively help in PERT Chart drawing.

Example 2. PERT Chart Template
It's a perfect possibility to start drawing from the PERT Chart template included in Seven Management and Planning Tools Solution. But if you want to draw your PERT Chart in new document, you can use the predesigned shapes from the PERT Charts library which is also included in Seven Management and Planning Tools Solution.

Example 3. PERT Charts Library Design Elements
Look at the sample above, you can see that PERT Charts library contains a variety of ready-to-use elements which are usually used for creating PERT Charts of any detailing.

Example 4. PERT Chart — Sales Problem Solution
This sample was created in ConceptDraw DIAGRAM using the Seven Management and Planning Tools Solution for ConceptDraw DIAGRAM and shows the PERT chart for the sale problem solving. The critical path is visually highlighted in red. An experienced user spent 15 minutes creating this chart.
Use the Seven Management and Planning Tools Solution for ConceptDraw DIAGRAM software to create your own professional looking PERT chart quick, easy and effective.
All source documents are vector graphic documents. They are available for reviewing, modifying, or converting to a variety of formats (PDF file, MS PowerPoint, MS Visio, and many other graphic formats) from the ConceptDraw STORE. The Seven Management and Planning Tools Solution is available for all ConceptDraw DIAGRAM or later users.
TEN RELATED HOW TO's:
Activity Network Diagram - This sample was created in ConceptDraw DIAGRAM diagramming and vector drawing software using the Seven Management and Planning Tools solution from the Management area of ConceptDraw Solution Park.
This sample shows the PERT (Program Evaluation Review Technique) chart of the request on proposal. A request for proposal (RFP) is a request of the company or the organization to potential suppliers to submit the business proposals for service or goods that it is interested to purchase. The RFP is represented on the initial procurement stage and allows to define the risks and benefits.
Picture: Activity Network Diagram Method
Related Solution:
The Critical Path Method (CPM) is an algorithm for scheduling a set of project activities. It is an important tool for effective project management. ConceptDraw PROJECT implements this method to provide the user with a wide set of project management tools.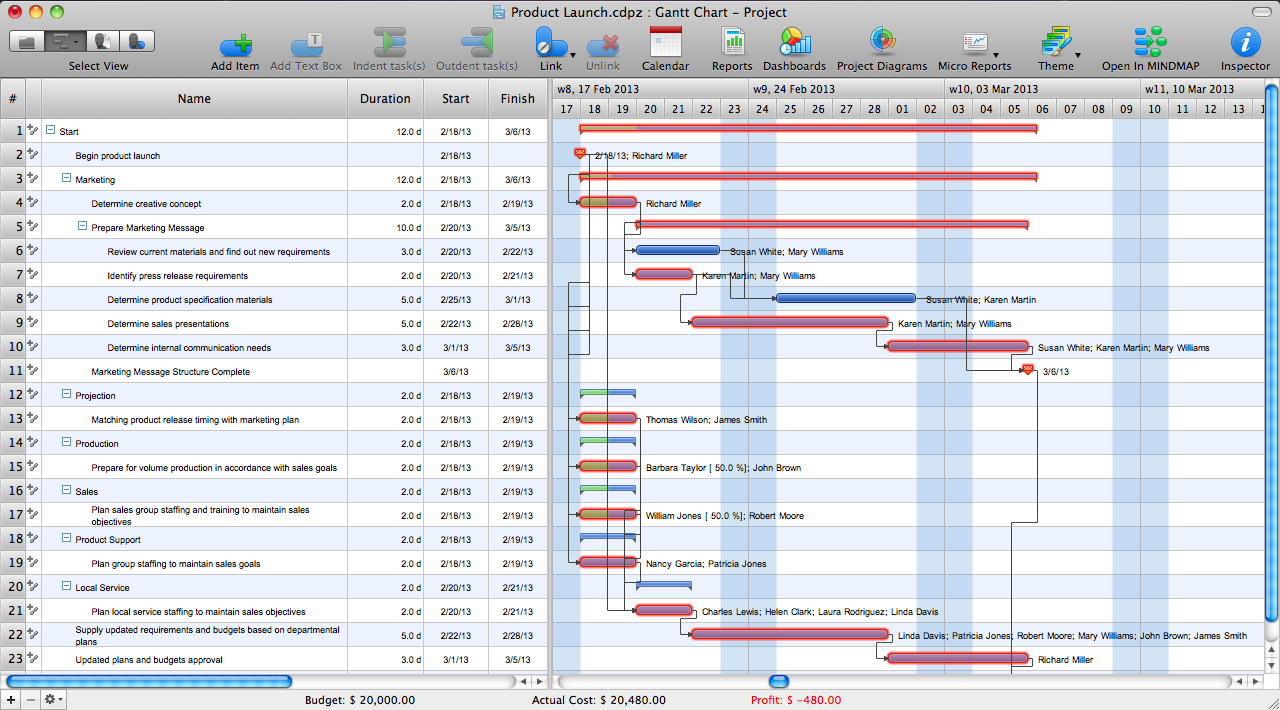
Picture: Critical Path Method in ConceptDraw PROJECT
Related Solution:
ConceptDraw PROJECT is a powerful Gantt Chart Software. The Gantt Charts are useful for displaying a large amount of detailed information, project tasks and timelines in a visually pleasing, easy-to-understand format.
ConceptDraw PROJECT provides wide capabilities of importing and exporting in various formats: Microsoft Project, ConceptDraw MINDMAP , Mindjet MindManager, PDF file.
Picture: Gantt Chart Software
Value Stream Map template helps you to create VSM diagrams using ConceptDraw DIAGRAM software.
Picture: How To create Value Stream Map (VSM)
Related Solution:
This sample was created in ConceptDraw DIAGRAM diagramming and vector drawing software using the UML Class Diagram library of the Rapid UML Solution from the Software Development area of ConceptDraw Solution Park.
This sample shows the structure of the building and can be used by building companies, real estate agencies, at the buying / selling of the realty.
Picture: UML Class Diagram Example - Buildings and Rooms
Related Solution:
The PERT Chart is constructed as part of the process in creating a schedule of corrective actions. The PERT Chart shows the logical connections and consequence of tasks to be performed. It displays the time period for problem solving and the implementation of all activities through the critical path.
ConceptDraw Office suite is a software for corrective actions planning.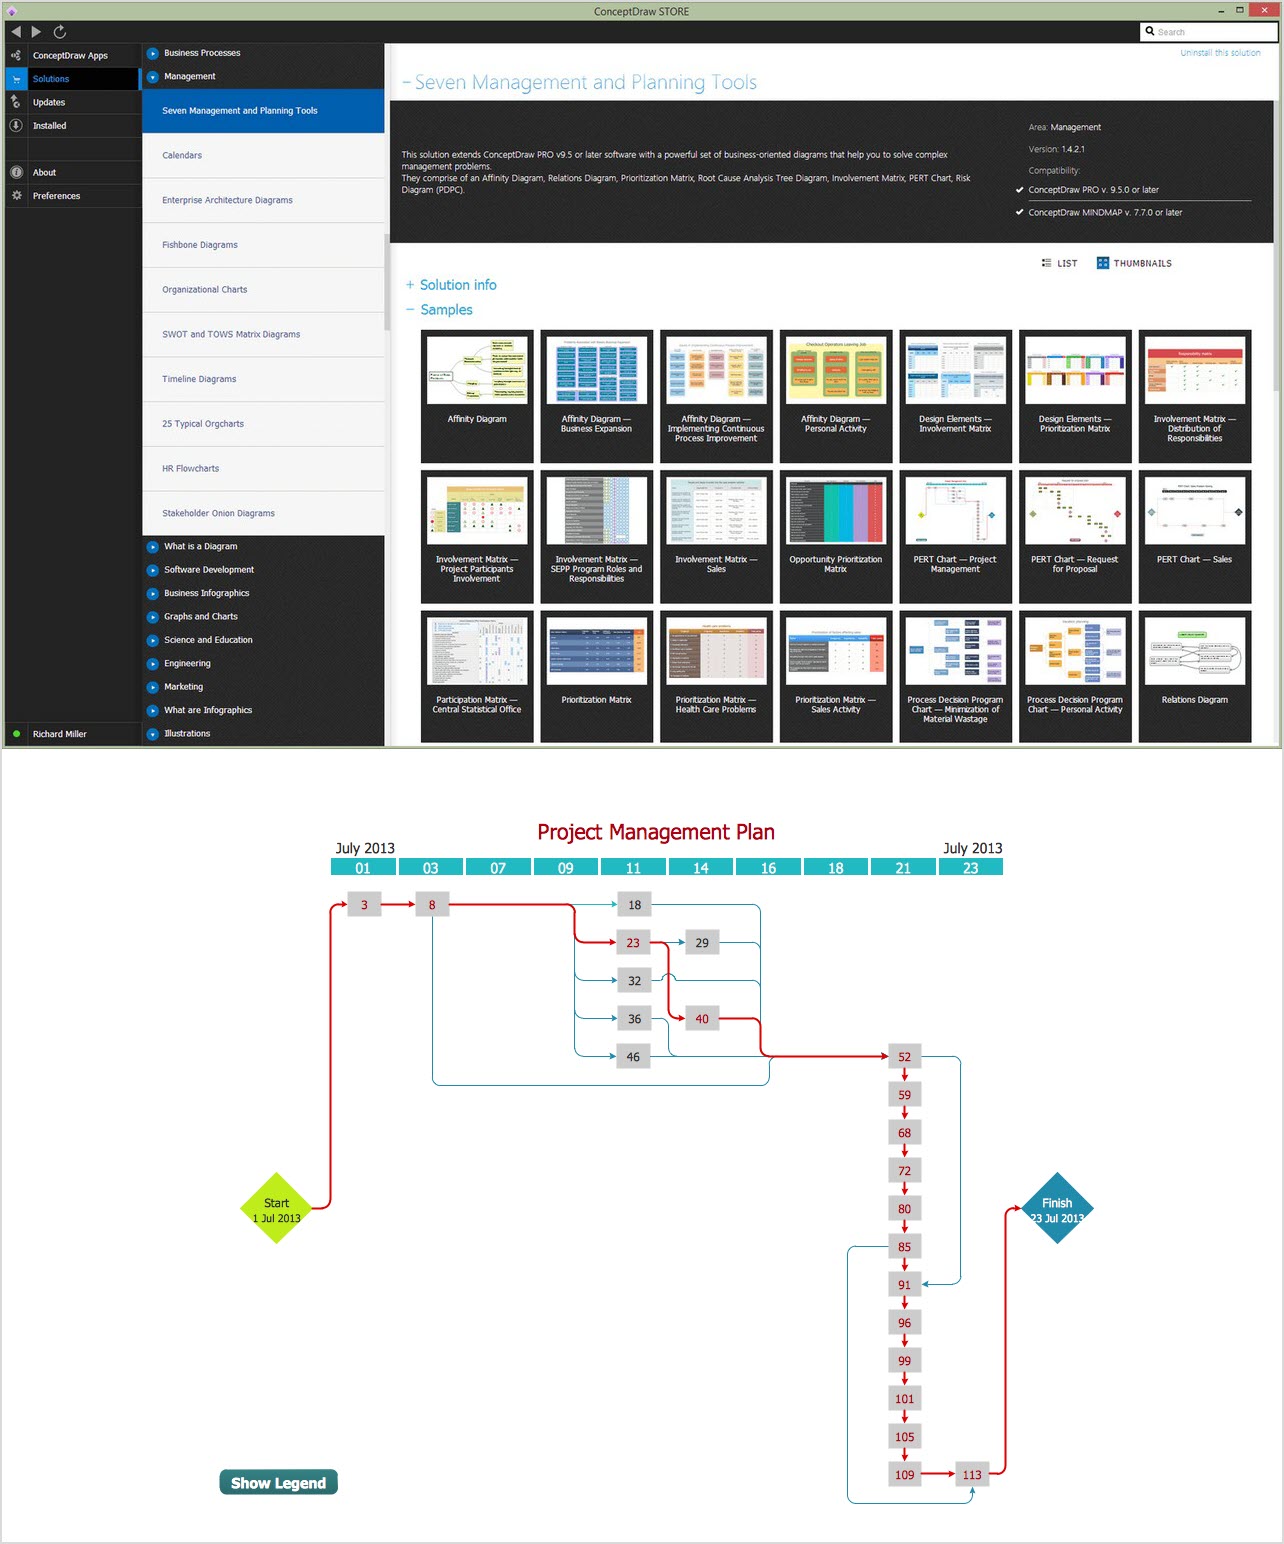
Picture: CORRECTIVE ACTIONS PLANNING. PERT Chart
PERT Chart Software - Activity Network and Project Evaluation and Review Technique, or PERT, charts are a way of documenting and analyzing the tasks in a project.
ConceptDraw DIAGRAM is a powerful diagramming and vector drawing software for designing professional looking PERT Charts quick and easy.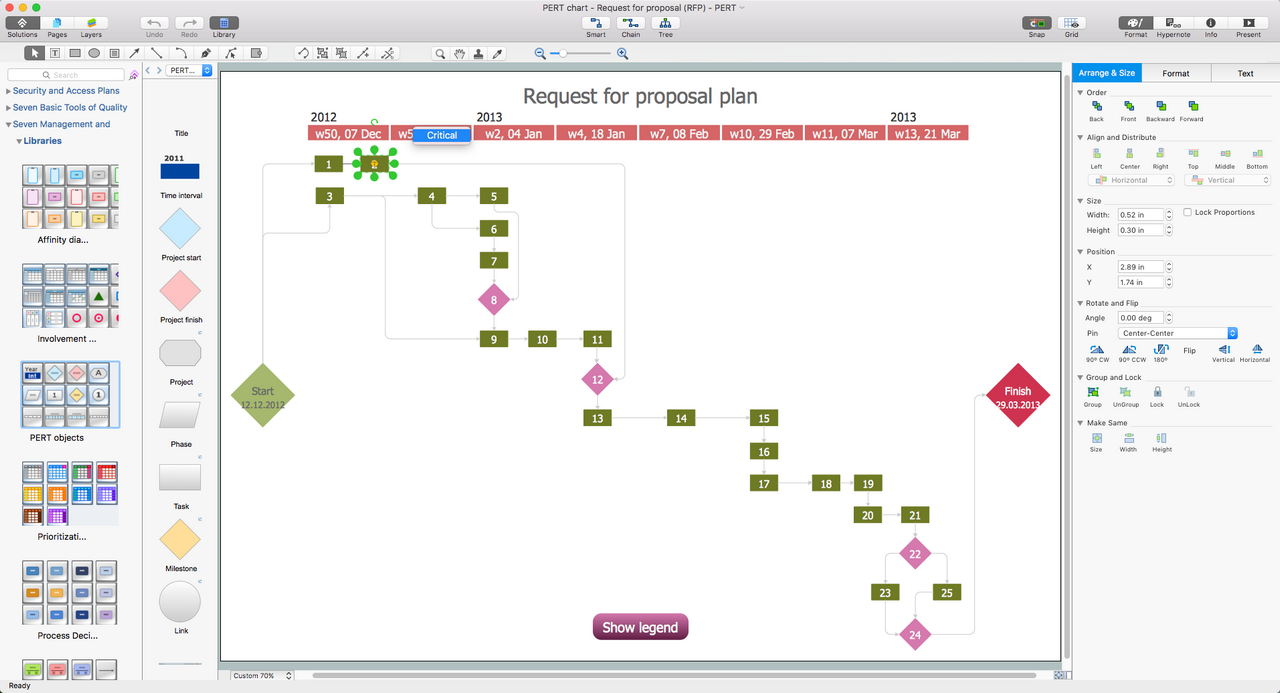
Picture: PERT Chart Software
Related Solution:
Big and complex projects sometimes need some simplification of plans and schedules. That's why Program Evaluation and Review Technique was invented and first implemented in 1958. You can create PERT diagrams effortlessly with ConceptDraw DIAGRAM and share them with your colleagues.
Program Evaluation Review Technique (PERT) is a method that is used to assess and analyze projects. PERT is a valuable tool for the project management practice. PERT gives an assessment and analysis of the time needed to the project completion. A PERT chart is a visual tool that delivers a graphical view of a project timeline. It is used to display the sequences and dependences of project tasks necessary to complete a project. ConceptDraw DIAGRAM delivers the possibility to build a PERT along with other diagrams applied to assist management process by using its Seven Management and Planning Tools solution.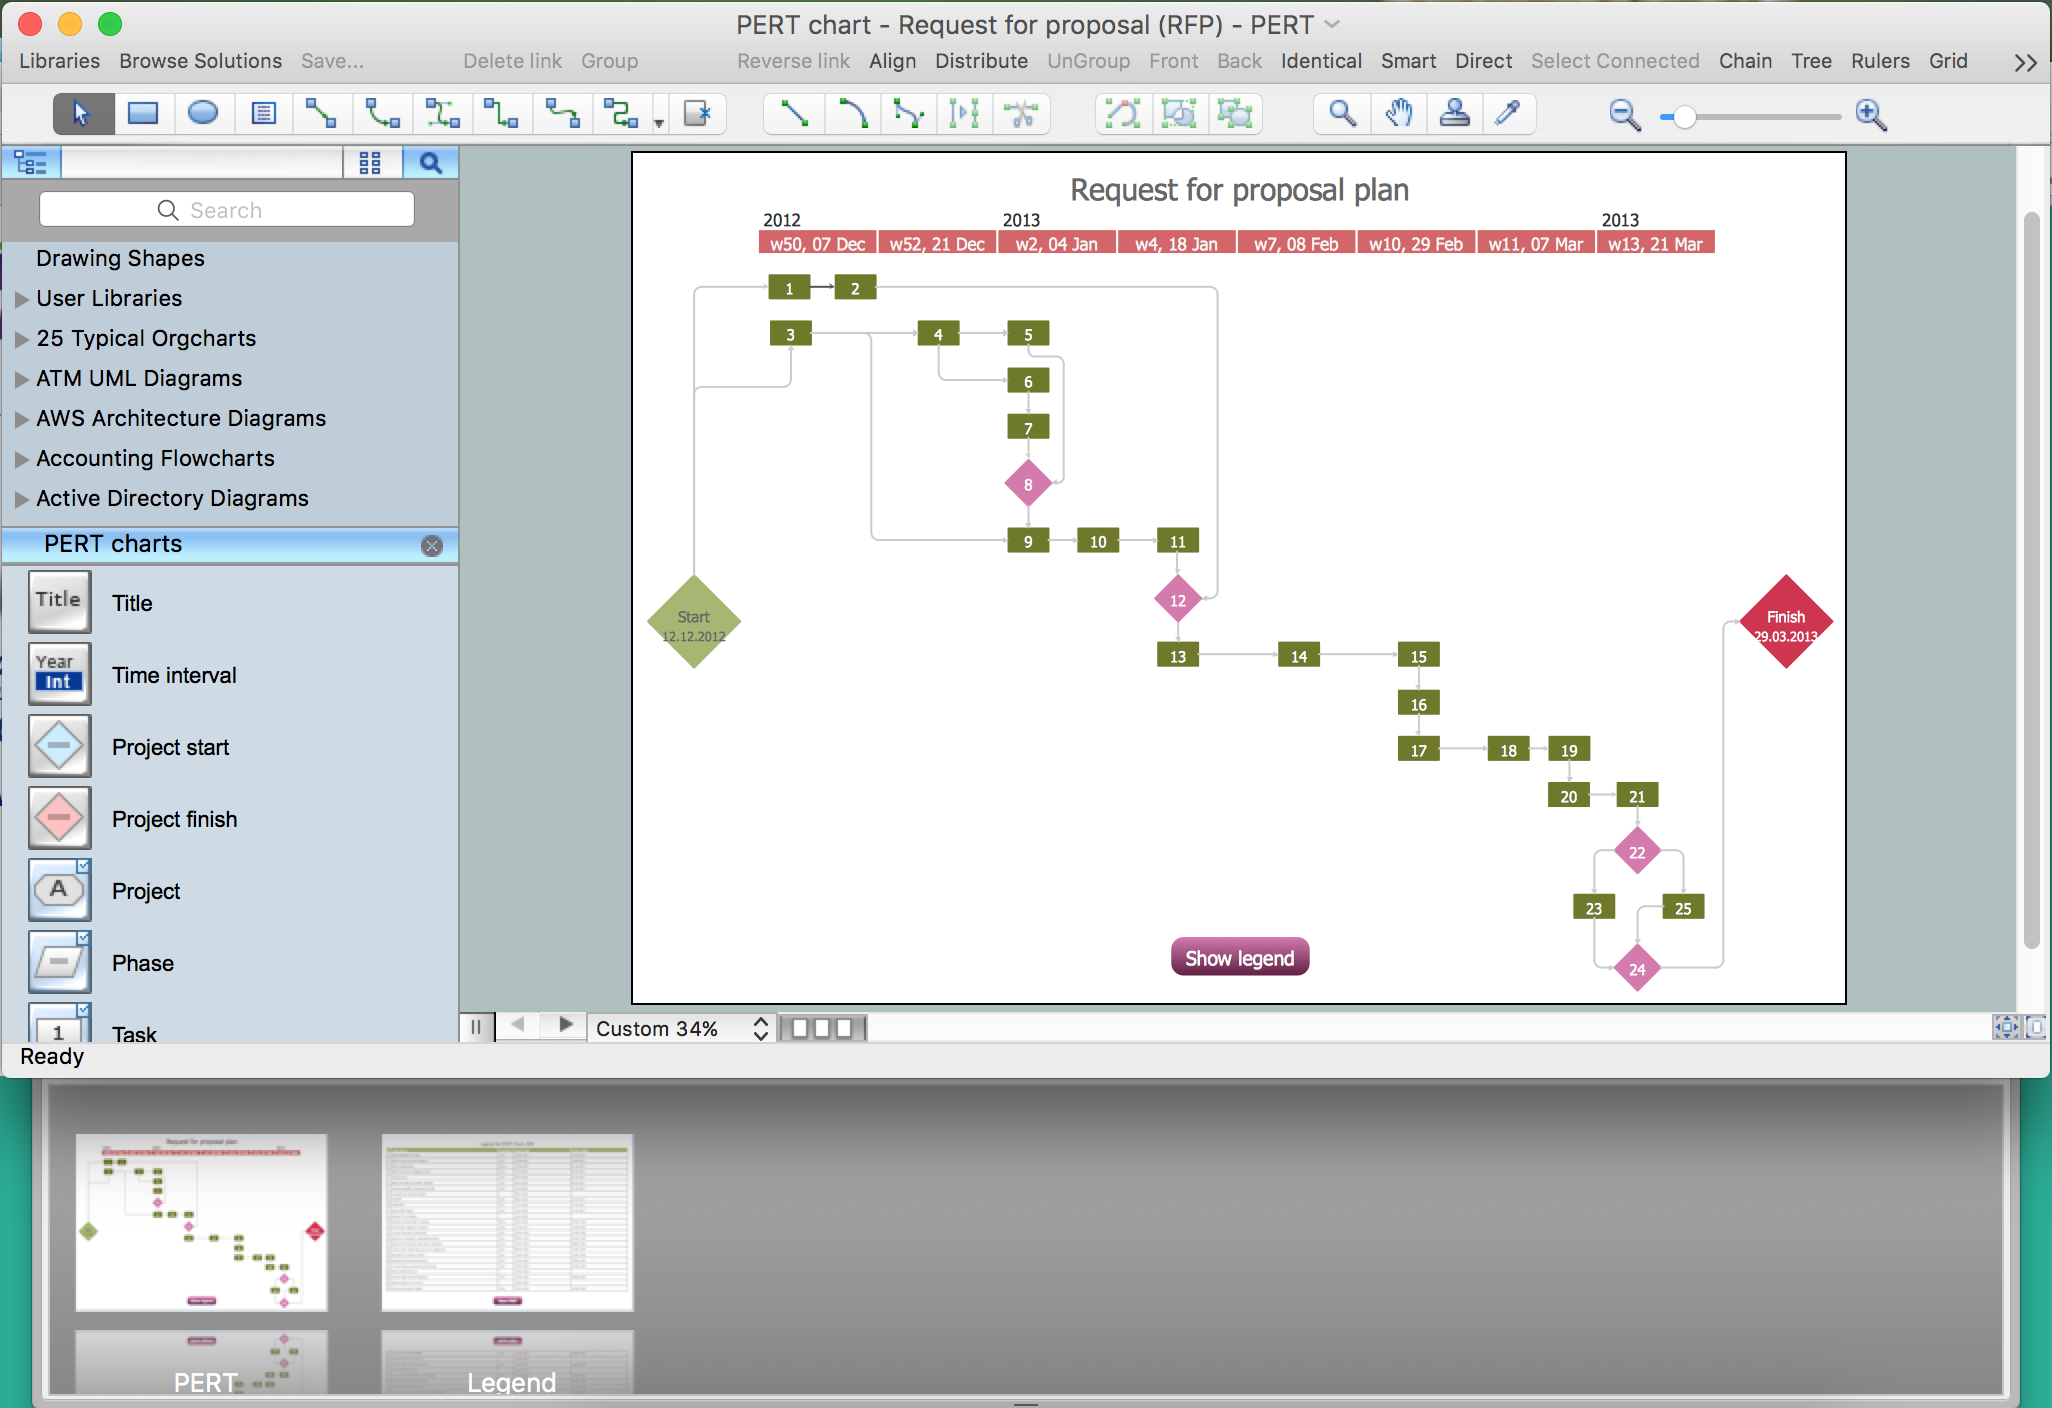
Picture: Program Evaluation and Review Technique (PERT) with ConceptDraw DIAGRAM
Related Solution:
ConceptDraw DIAGRAM diagramming and vector drawing software extended with Target and Circular Diagrams solution from the Marketing area of ConceptDraw Solution Park is a powerful tool for Daily Schedule Chart design.
Picture: Daily Schedule Chart
Related Solution:
ConceptDraw PROJECT is the Gantt chart software that implements critical path method to provide the user with a wide set of project management tools.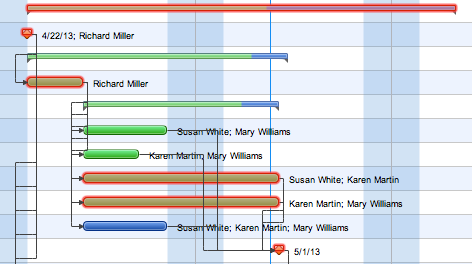
Picture: How to Discover Critical Path on a Gantt Chart


