KPIs and Metrics
Sales Dashboard Solution
ConceptDraw DIAGRAM is a software for making dashboards from various templates. The Sales Dashboard Solution include the templates that allow users to use live data in the dashboards that show KPI's. The clean and dynamic dashboard objects are driven by data files, and are updated automatically as the data changes. By using dashboards one obtain benefits:
- Visually performance presenting
- Identifying negative trends
- Generating detailed reports
- Align strategies and organizational goals
- Gain total visibility of all systems instantly
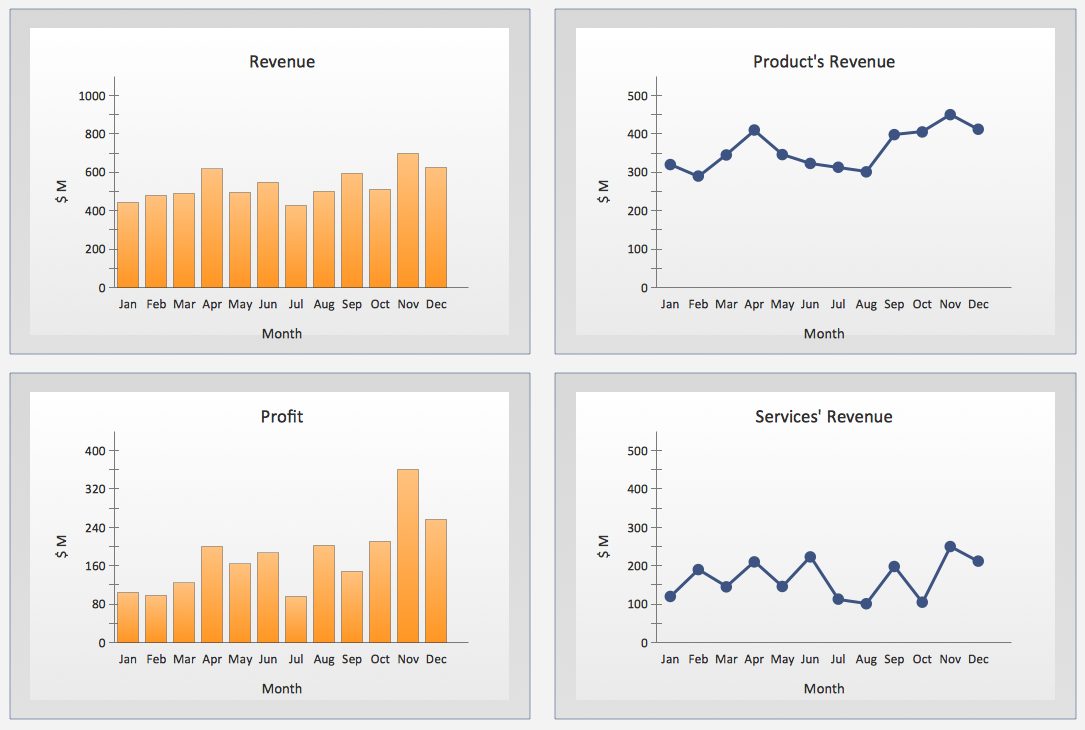
Pic. 1. Sales KPIs Dashboard Sample
THREE RELATED HOW TO's:
Don't let your first glance fool you. ConceptDraw is a lot easier to use than it looks. Use its cross-functional templates and library as basics to get started.
All you need to know are a few basic steps and terms.
ConceptDraw Arrows10 Technology is a new age in drawing software. Use it for process flows and its new rapid draw feature enables to draw an impressive charts in a seconds.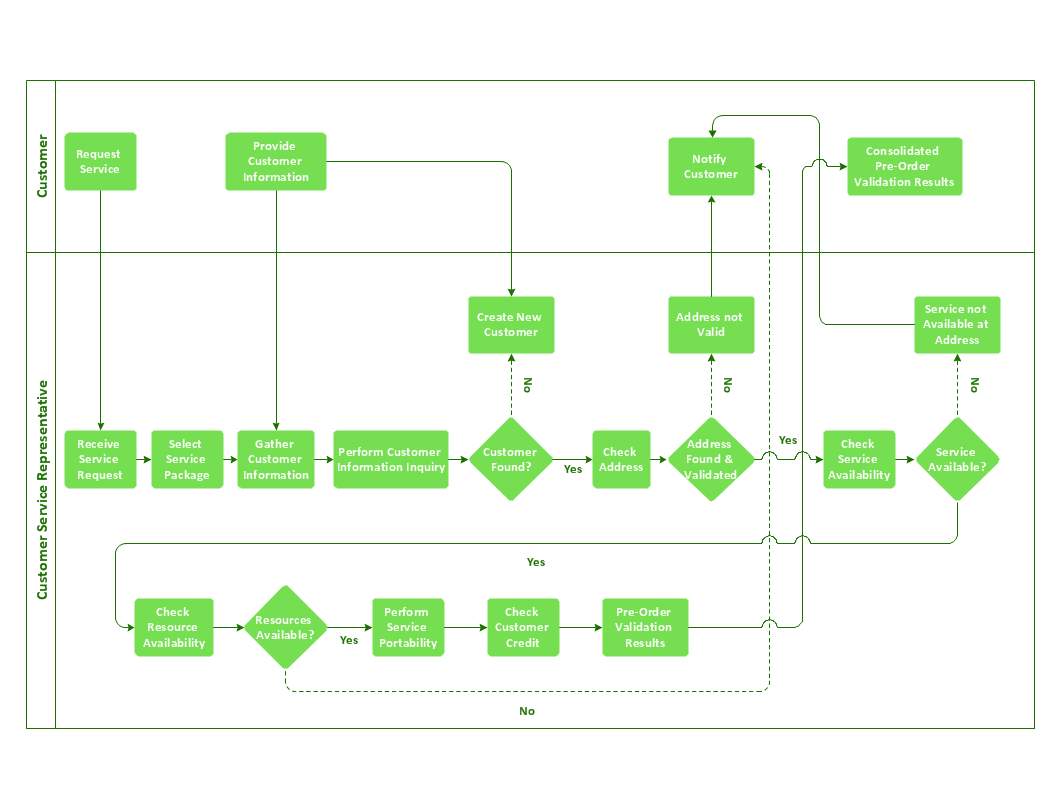
Picture: Cross-Functional Flowchart Basics
A combination of sales KPI on a one dashboard helps you track sales activities and results. Visualizing sales data using ConceptDraw DIAGRAM software extended with the Sales Dashboard solutiongives you flexibility in choosing and tuning KPIs.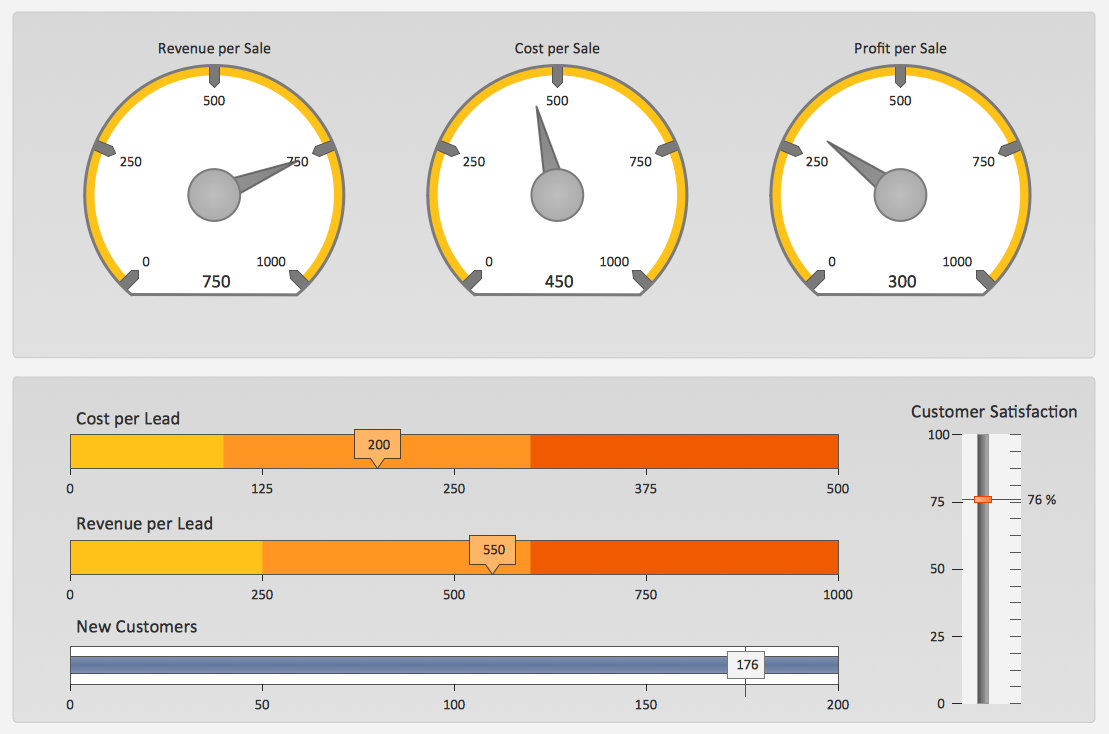
Picture: Sales KPI Dashboards
ConceptDraw DIAGRAM software extended with the Sales Dashboard solution allows you produce sales dashboards for your company easily. You can start from samples and templates delivered with the solution and then modify them to get a dashboard that suites your specific needs.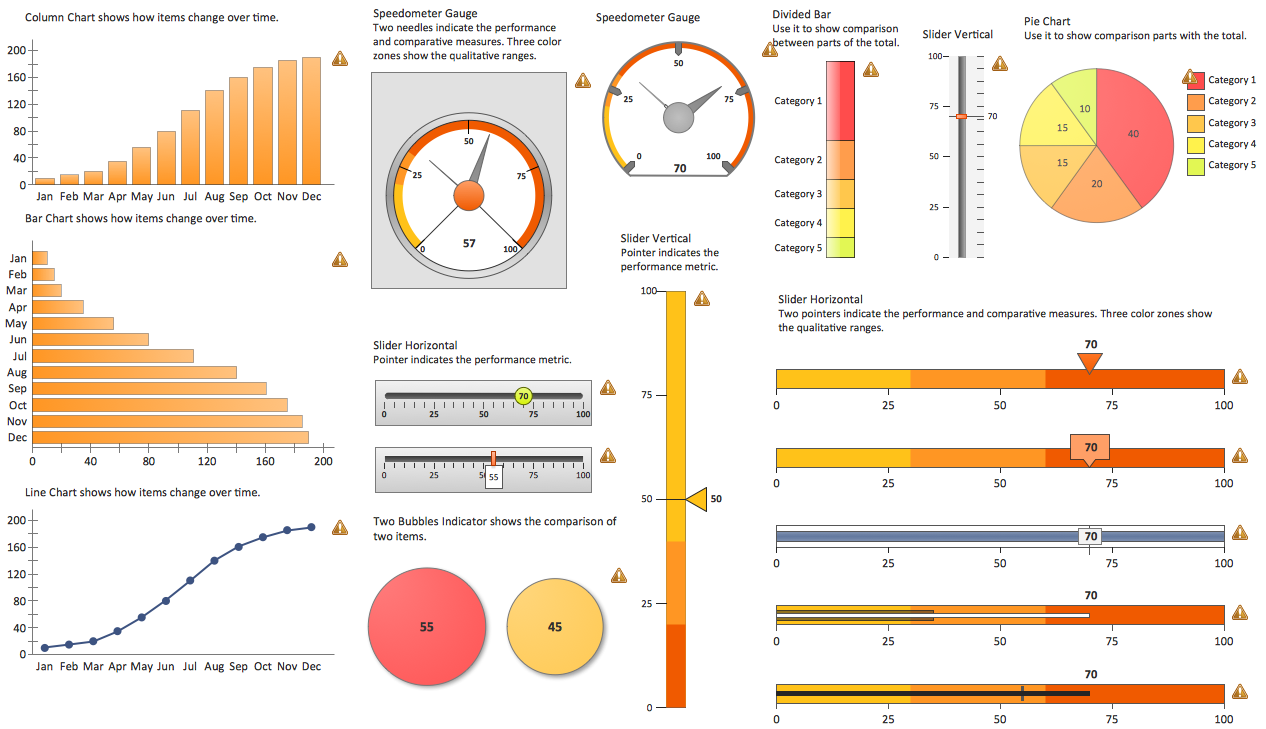
Picture: Sales Dashboards for Your Company
ConceptDraw
DIAGRAM 18