Sales Dashboards for Your Company
Sales Dashboard Solution
The Sales Dashboard Solution gives managers the ability to use live data to drive displays that show company performance in a wide variety of graphs. ConceptDraw DIAGRAM is a software for making Live graphic data that provide effectiveness to your business. By using dashboards owners or stockholders can obtain benefits:
- Visually performance presenting
- Generating detailed reports
- Gain total visibility of all systems instantly
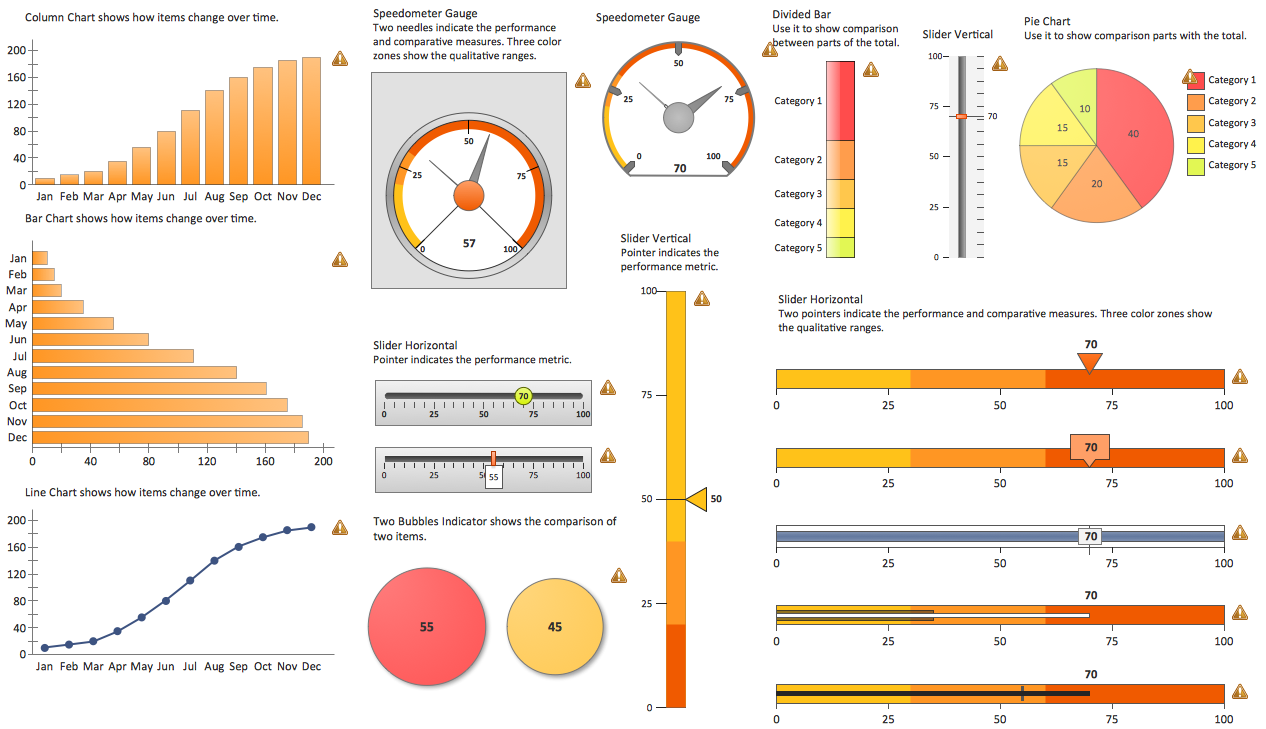
Pic. 1. Sales Dashboards
NINE RELATED HOW TO's:
ConceptDraw DIAGRAM diagramming and vector drawing software offers the useful tools of the Sales Dashboard solution from the Marketing area for easy creating professional looking live dashboards which allow to track the business sales activity and progress thanks to representing the Key Performance Indicators (KPIs) on them.
Picture: Performance Indicators
Related Solution:
Interactive tool helps you find the appropriate response to social media mentions quickly.
Picture: How to Use the ″Online Store PR Campaign″ Sample
Related Solution:
ConceptDraw offers you a number of ready-made organizational chart templates which you can use in your drawing. They are grouped in topical sets as organizational chart template files.
Use the Organizational Charts Solution for ConceptDraw DIAGRAM to create your own Organizational Charts of any complexity quick, easy and effective.
The Organizational Charts designed with ConceptDraw DIAGRAM are vector graphic documents and are available for reviewing, modifying, converting to a variety of formats (image, HTML, PDF file, MS PowerPoint Presentation, Adobe Flash or MS Visio XML), printing and send via e-mail in one moment.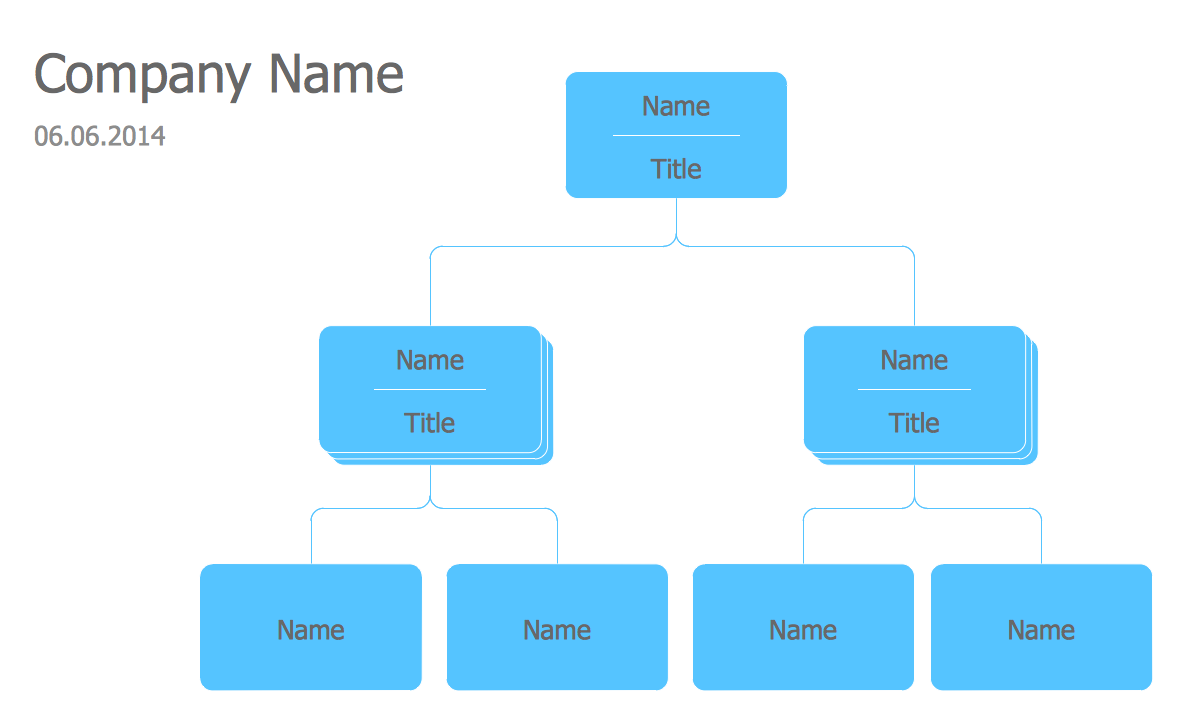
Picture: Organizational Chart Templates
Related Solution:
When strategy manager deals with planning a strategy statements for the some upcoming period commonly he use a SWOT matrix to analyse. Filling the four sectioned matrix, helps manager to determine what external and internal factors are influenced on the company's position at the market. And where hidden potential opportunities and threats. Using mind map, made in ConceptDraw MINDMAP it is easy to capture all factors of influence. The next stage is turn a mind map into SWOT matrix with just one click by using the ConceptDraw solution for SWOT and TOWS diagrams.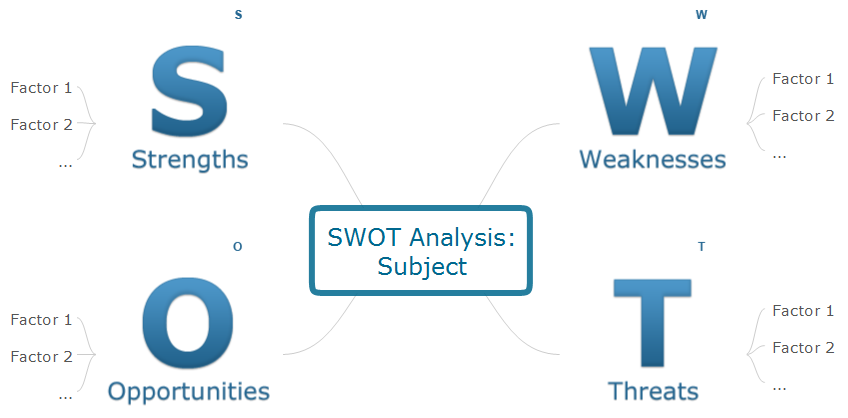
Picture: SWOT analysis Software & Template for Macintosh and Windows
The vector stencils library Chen ERD from the solution Entity-Relationship Diagrams (ERD) contains specific symbols of the Chen ERD notation including entity symbols and relationship symbols for ConceptDraw DIAGRAM software.
Picture: Chen ERD Diagram
Related Solution:
Developing Restaurant Layouts is very important and responsible moment in restaurant construction and designing. Now it's very simple and fast process thanks to the Cafe and Restaurant Floor Plans solution from the Building Plans area of ConceptDraw Solution Park.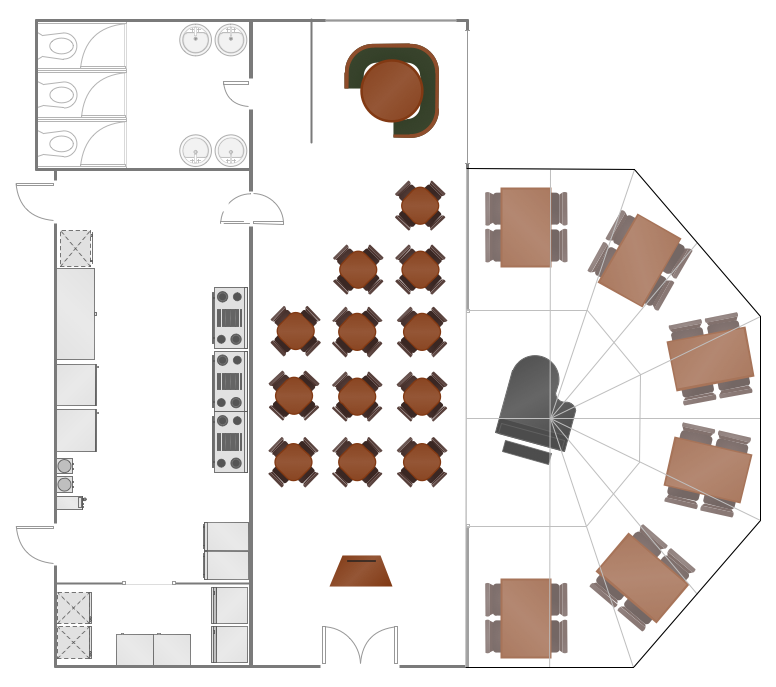
Picture: Restaurant Layouts
Related Solution:
Root Cause Analysis Tree Diagram. Use the Root Cause Diagram to perform visual root cause analysis. Root Cause Analysis Tree Diagram is constructed separately for each highly prioritized factor. The goal of this is to find the root causes for the factor and list possible corrective action.
ConceptDraw Office suite is a software for problem analysis.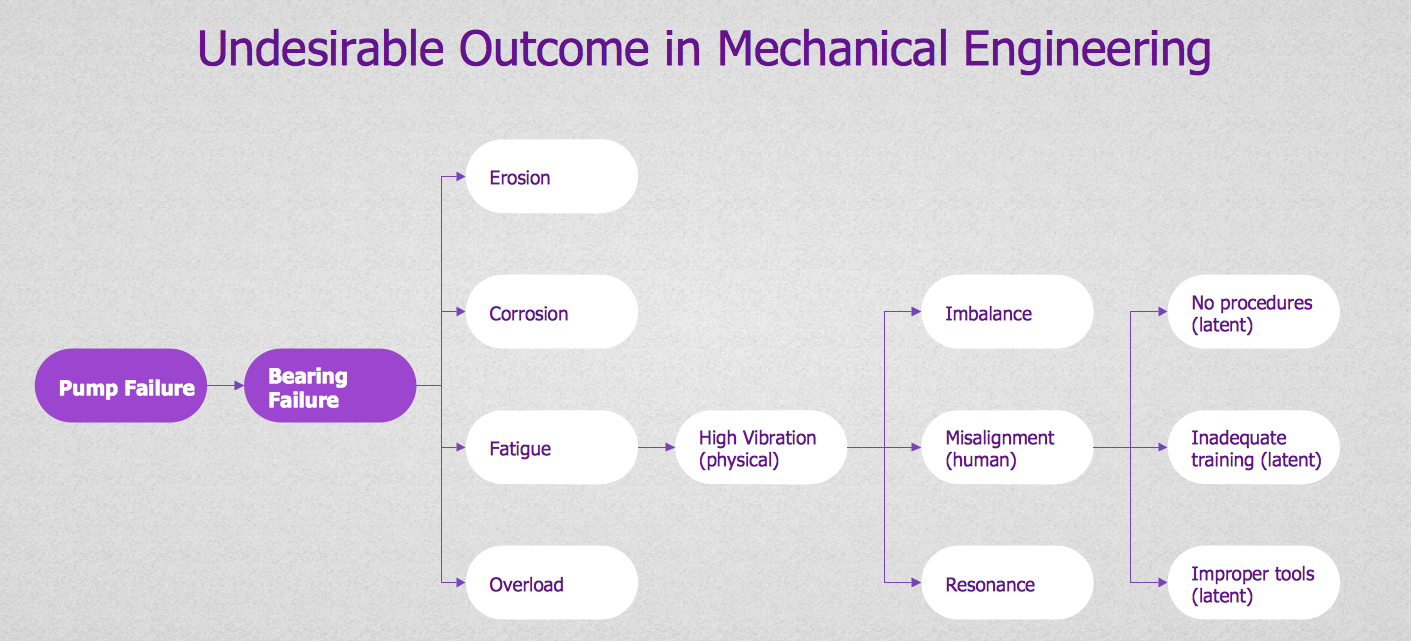
Picture: PROBLEM ANALYSIS. Root Cause Analysis Tree Diagram
The best bar chart software ever is ConceptDraw. ConceptDraw bar chart software provides an interactive bar charting tool and complete set of predesigned bar chart objects.
Picture: Bar Chart Software
Related Solution:
Event-Driven Process Chain flowcharts for improvement throughout an organisation.
ConceptDraw DIAGRAM is a software for making EPC flowcharts to provide business process modelling. Its excellent business process improvement tools.
Picture: An Event-driven Process Chain (EPC) - flowchart used for business process modelling
Related Solution:
ConceptDraw
DIAGRAM 18