Network Diagram Software
Logical Network
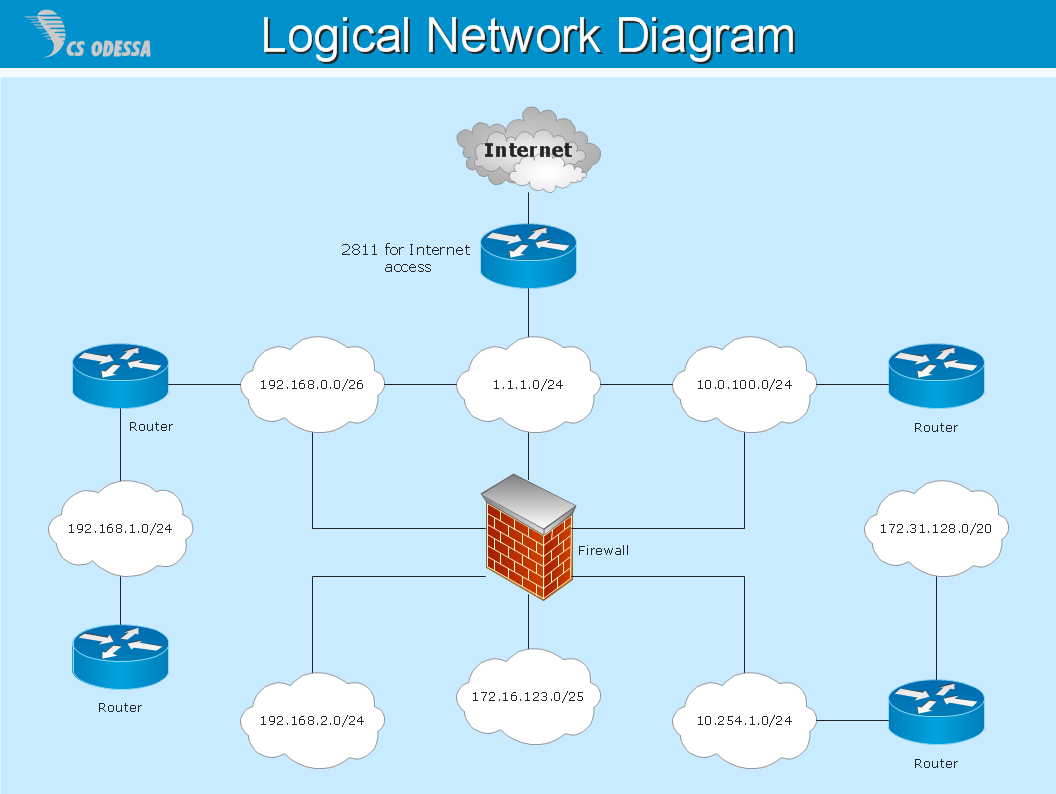
Logical Network Diagraming
Logical Network Diagrams visualize the telecommunication and computer networks logical structure. They are used by IT professionals and corporate IT departments, network and system administrators to visually document the logical topology of computer networks.
ConceptDraw has 1004 vector stencils in the 40 libraries that helps you to start using software for designing your own Logical Network Diagrams.
You can use the appropriate stencils from Computer and Network Diagrams object libraries.

See also Samples:
TEN RELATED HOW TO's:
ConceptDraw Wireless Network solution includes 81 of professional-looking stencils and several samples that you can modify and make your own diagram.

Picture: How to Create Network Diagrams
Related Solution:
WLAN →
ConceptDraw DIAGRAM diagramming and vector drawing software extended with Wireless Networks Solution gives the ability to its users to create professional looking WLAN schemes and diagrams quick and easy.
Picture: WLAN
Related Solution:
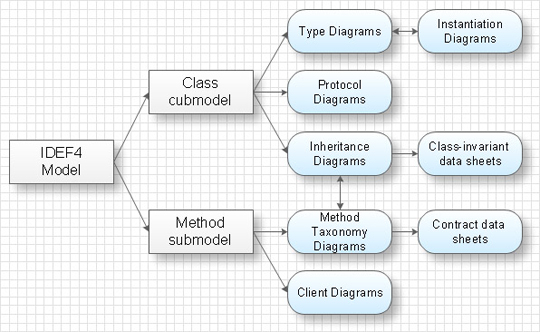
Use Case Diagrams technology. IDEF4 standard implies not only graphical presentation but the additional information about diagrams of heredity, methods systematization and types which are contained in specifications.

Picture: IDEF4 Standard
Fishbone diagram is a powerful tool used for solving business problems and obstacles. ConceptDraw DIAGRAM software extended with Fishbone Diagrams solution from the Management area of ConceptDraw Solution Park is a helpful tool for cause and effect analysis. It gives the ability to easy identify many possible causes and factors which cause the effects and to draw Fishbone Diagrams for problem solving.

Picture: Cause and Effect Analysis - Fishbone Diagrams for Problem Solving
Related Solution:
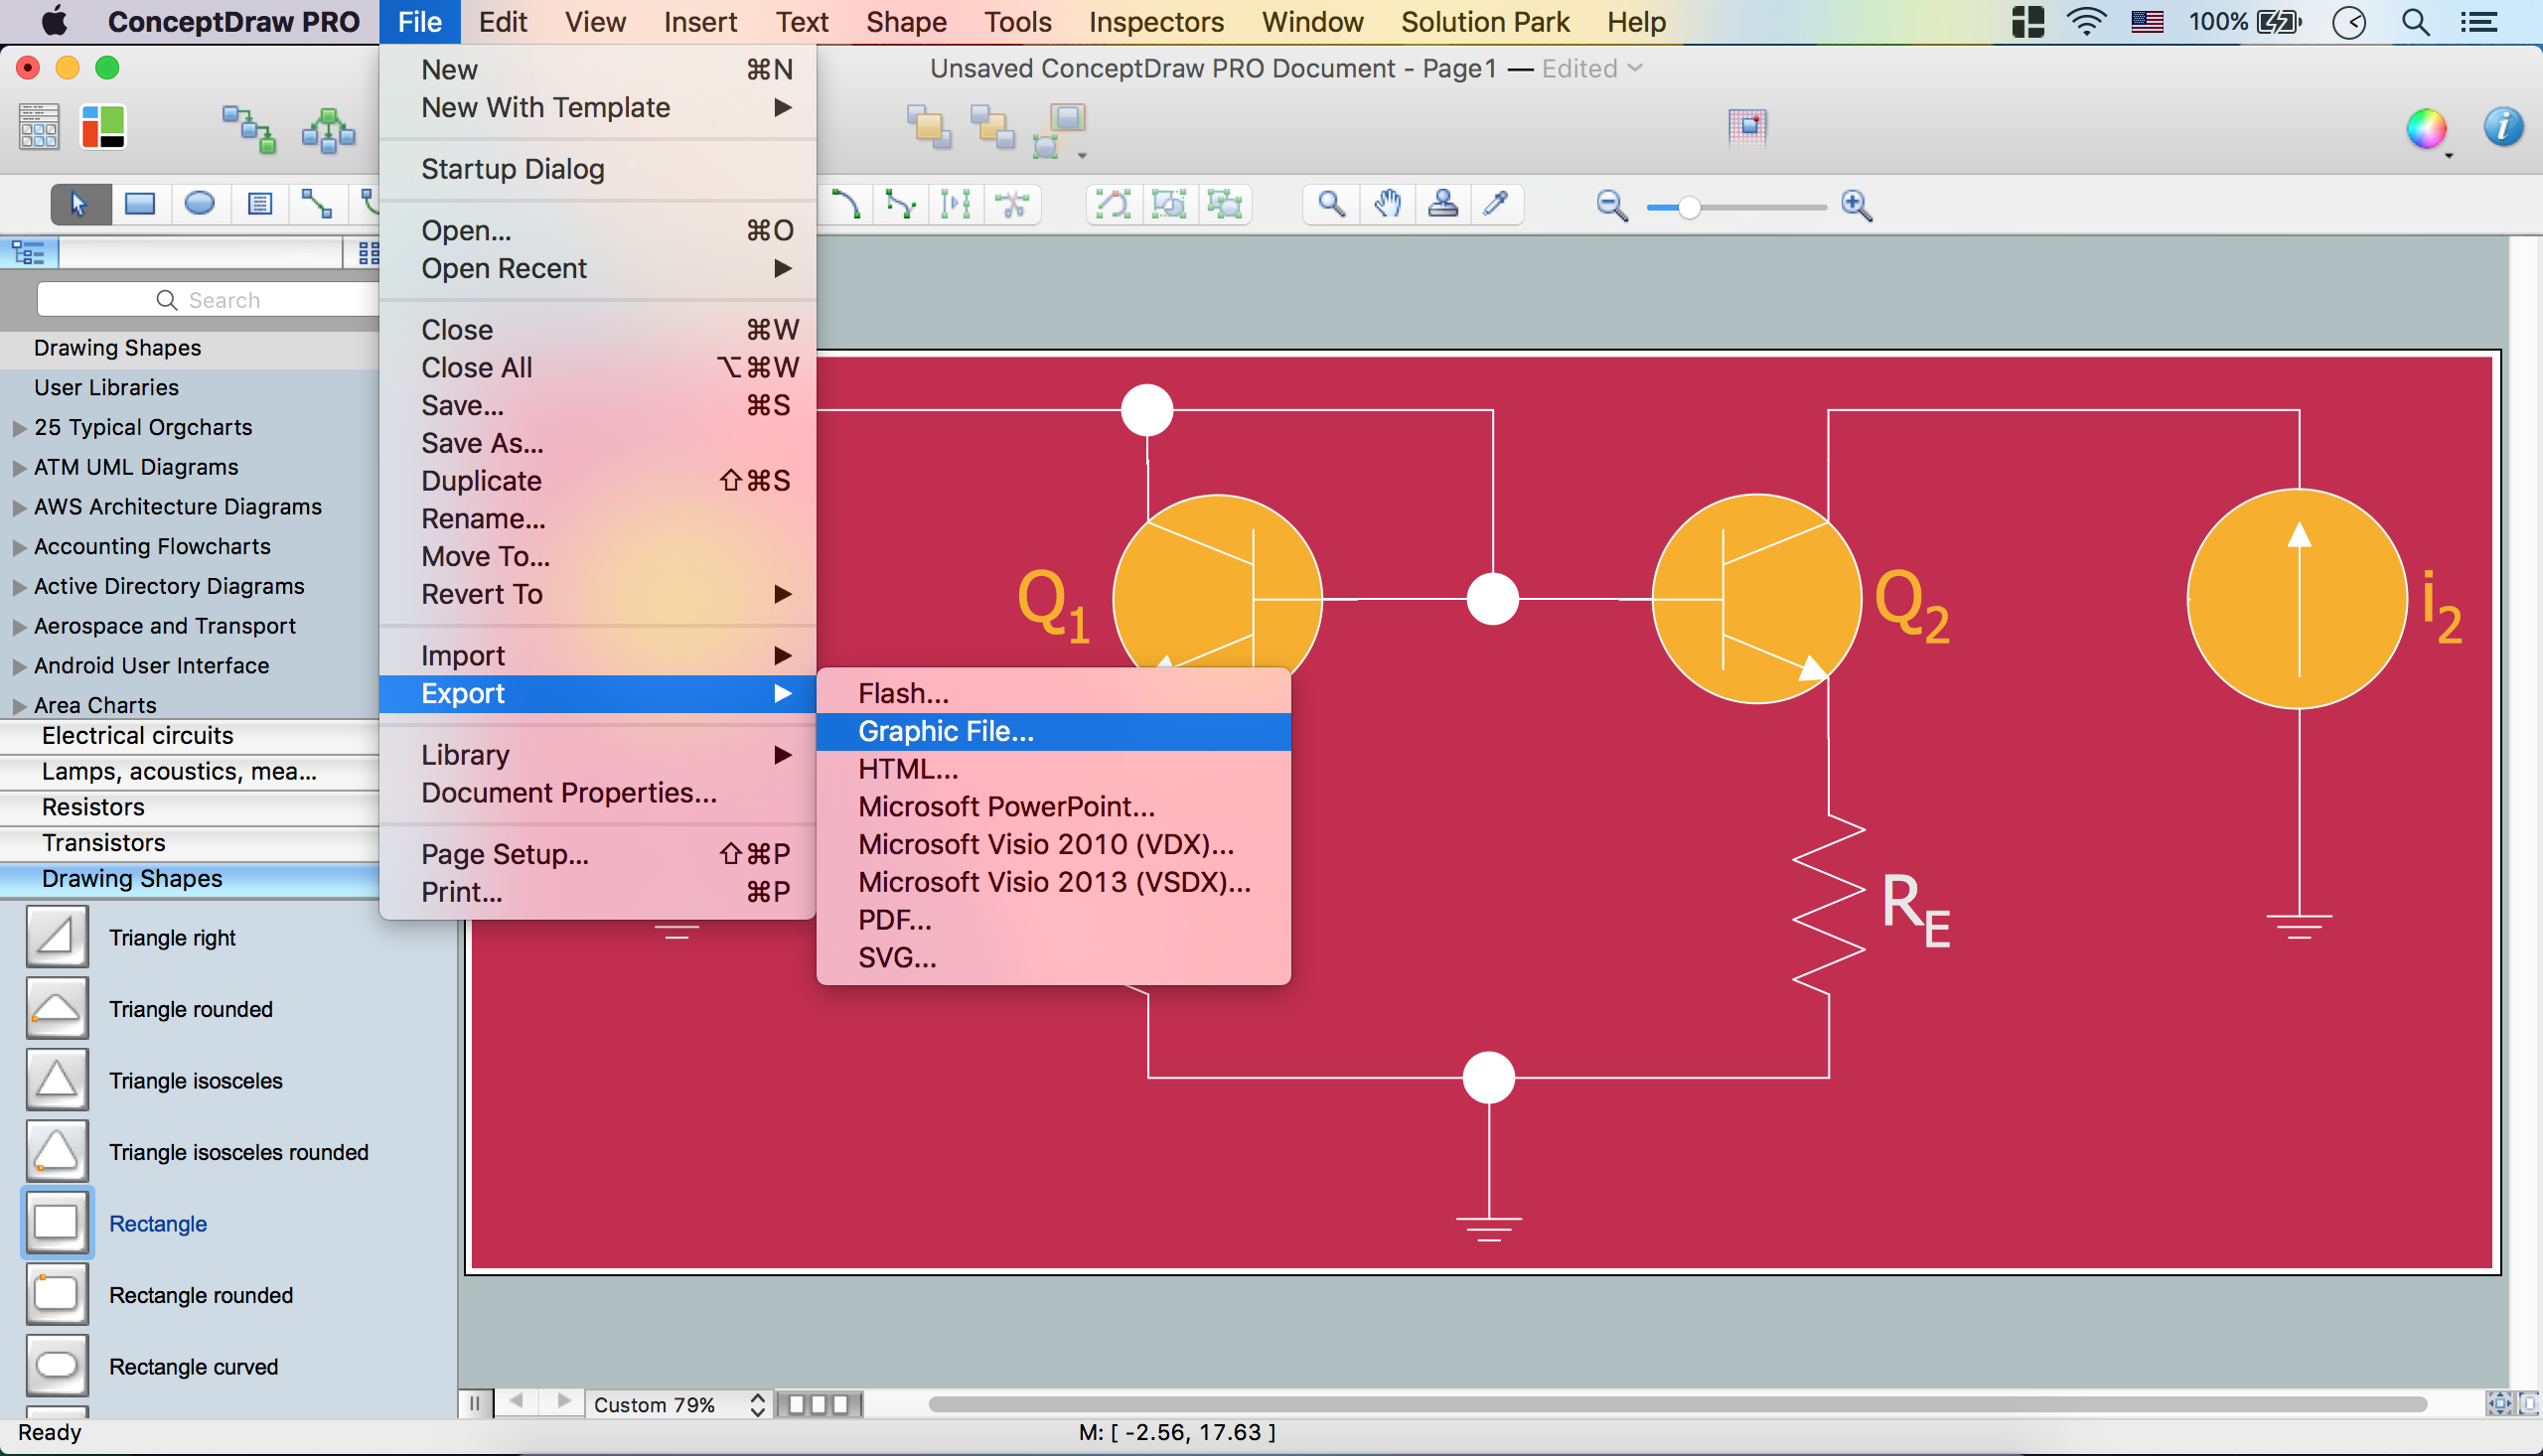
A circuit diagram is sometimes also called an elementary diagram, electronic schematic or electrical diagram circuits. It is essential in construction of any electronic equipment. Among many digital drawing tools available, ConceptDraw DIAGRAM is a leading circuits and logic diagram software, affording for easy and quick creation of even the most advanced and complex diagram designs. This makes it a perfect choice for computer science and any kind of electronic engineering.
This drawing includes the graphic symbols that may be in use while creating a logic circuit diagram. The diagrams of such kind are used in the electronics industry. The logic symbol depicts a device that realizes a Boolean type functions. Practically a logic symbol means transistor, diodes, relays, and other mechanical or optical details which provide function of closing or opening "gates". Totally the logic circuits can involve millions of gates. ConceptDraw Electrical Engineering solution gives the opportunity to create a circuit diagrams both simple and difficult.

Picture: Circuits and Logic Diagram Software
Related Solution:
Computer networks nowadays are spread all across the world. The large number of parameters, such as geographic scale or communication protocols, can divide networks. One of the most common types of networks is called local area network (LAN). It convenient to represent network examples by means of diagrams.
This local area network (LAN) diagram provides an easy way to see the way the devices in a local network are interacted. The diagram uses a library containing specific symbols to represent network equipment , media and the end-user devices such as computers (PC, mac, laptop) , network printer, hubs, server and finally a modem. There are two types of network topologies: physical and logical. The current diagram represents precisely a physical type of LAN topology because it refers to the physical layout of a local network equipment.

Picture:
What is a Local Area Network?
Examples of LAN Diagrams
Related Solution:
Working with disordered network data can be quite exhausting. Sometimes it's necessary to find a network diagramming software to design Cisco network diagrams that would be easy to use and would be able to export diagrams to various graphic formats. ConceptDraw DIAGRAM is a great diagramming tool that is able to perform all these tasks easily.
This vector library represents a set of 26 objects depicting the manufacturer - standard equipment of Cisco switches and hubs. This is only a small part of the vector graphic objects of Cisco equipment that comprise the Cisco Network Diagrams solution. In full the ConceptDraw Cisco Network Diagrams solution has 15 libraries, containing more then 500 objects to create a Cisco network diagrams. They can be used by IT specialists and corporative IT divisions, system and network administrators to make the visual documentation of Cisco networks topology.

Picture: Network Diagramming Software for Design. Cisco Network Diagrams
Related Solution:
A computer network diagram is a schematic representation the nodes and connections between them in a computer network.
ConceptDraw DIAGRAM is a powerful diagramming and vector drawing software for creating professional looking, detailed, visual and clear computer network diagrams. The Computer and Networks solution from Computer and Networks area of ConceptDraw Solution Park provides templates, samples and libraries with predesigned objects to help you design the computer network diagrams of any difficulty simply, quickly and effectively.

Picture: Network Diagram Software
Related Solution:
A Near-me area network (NAN) is a logical communication network. NAN focuses on the communication between wireless devices in the close proximity.
All networks designed with ConceptDraw DIAGRAM are vector graphic documents and are available for reviewing, modifying, and converting to a variety of formats (image, HTML, PDF file, MS PowerPoint Presentation, Adobe Flash or MS Visio XML).

Picture: Near-me area networks (NAN). Computer and Network Examples
Related Solution:
Beginning from the 19th century, people tried to tame electricity. Nowadays, electrical engineering covers a wide range of applications starting from providing illumination in our homes to developing space technologies. Considering the fact that every project needs documentation, engineers use electrical diagram software to develop these projects. Standard electrical symbols of electrical components are recognizable all around the world.
This illustration represents the 26 libraries that are supplied by the ConceptDraw Electrical Engineering solution. The Electric Engineering libraries contains about a thousand objects enabling you to draw various charts depicting electrical connections and circuits, along with schemes of different equipment and devices. The electric engineering libraries delivered with ConceptDraw solution meet the standards adopted in the image to electrical circuits. So they can be used by professionals along with amateurs in electrical engineering.

Picture: Electrical Diagram Software
Related Solution:
ConceptDraw
DIAGRAM 18