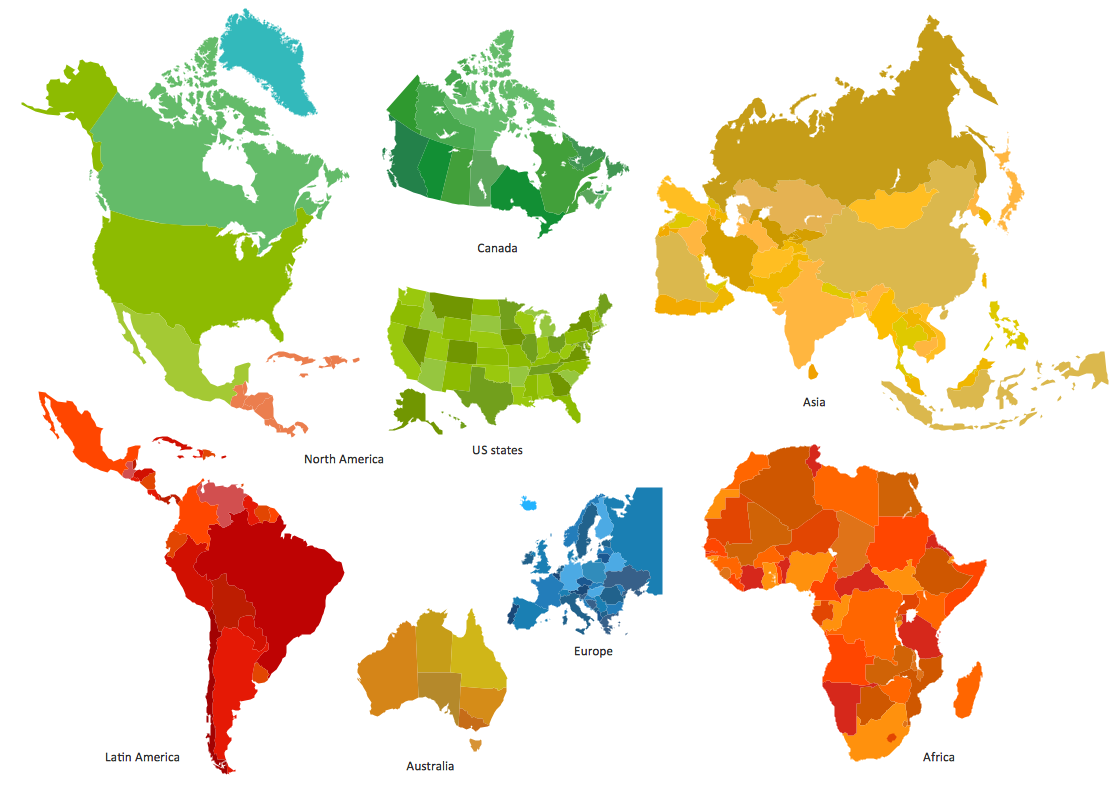
Sample 1. Design elements - Continent and country maps.
Solution Spatial Infographics from ConceptDraw Solution Park extends ConceptDraw DIAGRAM ector diagramming and business graphics software with easy-to-use spatial infographics drawing tools.
This solution contains spatial infographics samples, map templates to be filled in, and libraries of vector stencils for main design elements of spatial infographics.
Use this solution to draw your own geospatial infographics documents with thematic maps, road maps, directional maps and transport maps.
TEN RELATED HOW TO's:
Take inspiration with ConceptDraw to visualise your maps and make eye-catching infographics.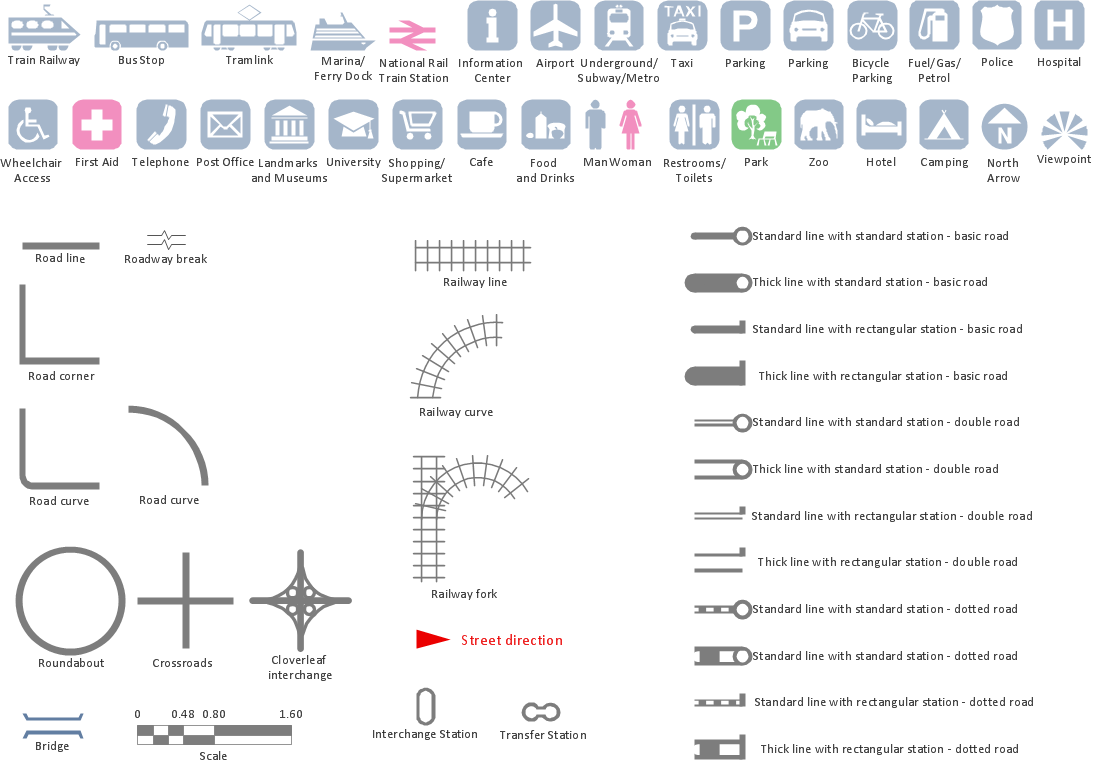
Picture: Map Infographic Maker
ConceptDraw is a best data visualization tool that will allow everyone to create rich infographics and visualizations quickly and easily.Picture: Best Tool for Infographic Construction
ConceptDraw the best business process modeling tool to make flow chart diagrams.
Start creating your own flowchart with ConceptDraw DIAGRAM and accomplish great results in the moment. This is the best program to make flow chart diagrams that gives users the ability to simply draw any type of flowchart. The fast creating visualization for the structural data with the vector stencils from object libraries by using RapidDraw technology makes ConceptDraw DIAGRAM the first program in drawing flow data.
Picture: Best Program to Make Flow Chart Diagrams
Related Solution:
If you need to describe some process, diagramming is a perfect tool for almost any imaginable purpose. The set of the most commonly used flow charts symbols is quite wide and includes symbols for operations, processes, data inputs and outputs. You can see the full list of all the symbols used for flowcharting in Flowcharts solution from Diagrams area in ConceptDraw Solution Park.
A flow chart is often used for visual representation of a sequential process flow. The flowchart approach to any process is to divide it into some sequential actions. What makes a flow chart so popular and clear to make out is the set of standard flowchart symbols that has the same reading independently from processes described with their applying. The current drawing represents the vector library containing the pack of standard flowchart symbols. This library is supplied with ConceptDraw Flowcharts solution.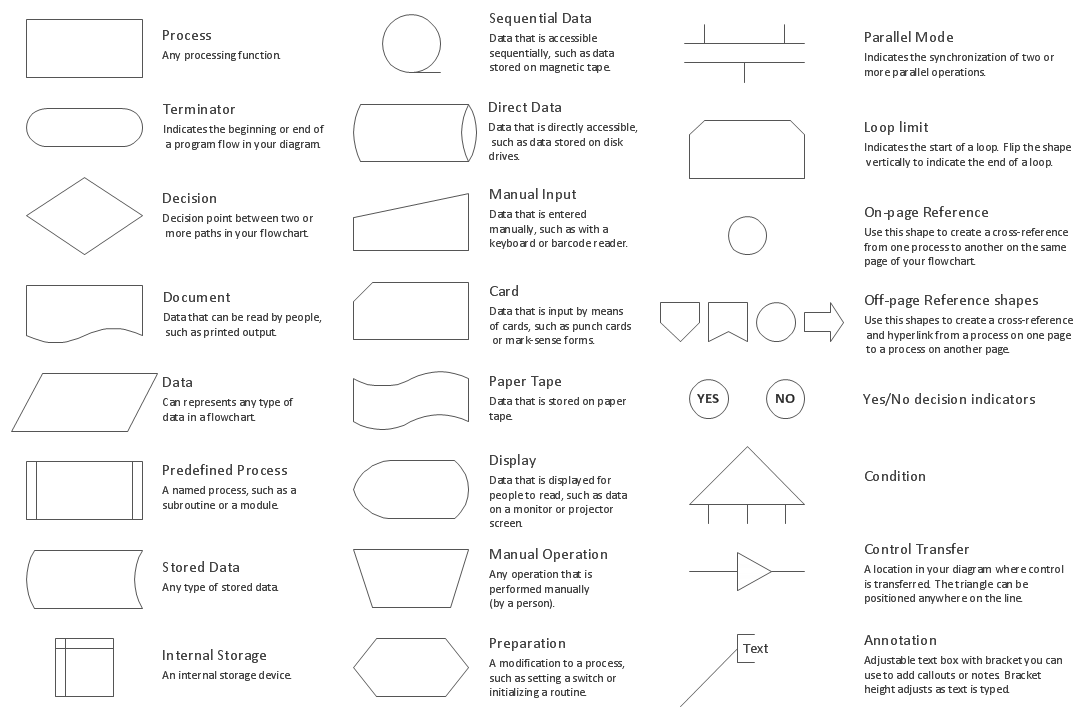
Picture: Flow Chart Symbols
Related Solution:
Follow samples and map templates to create nfographic maps. It's super-easy!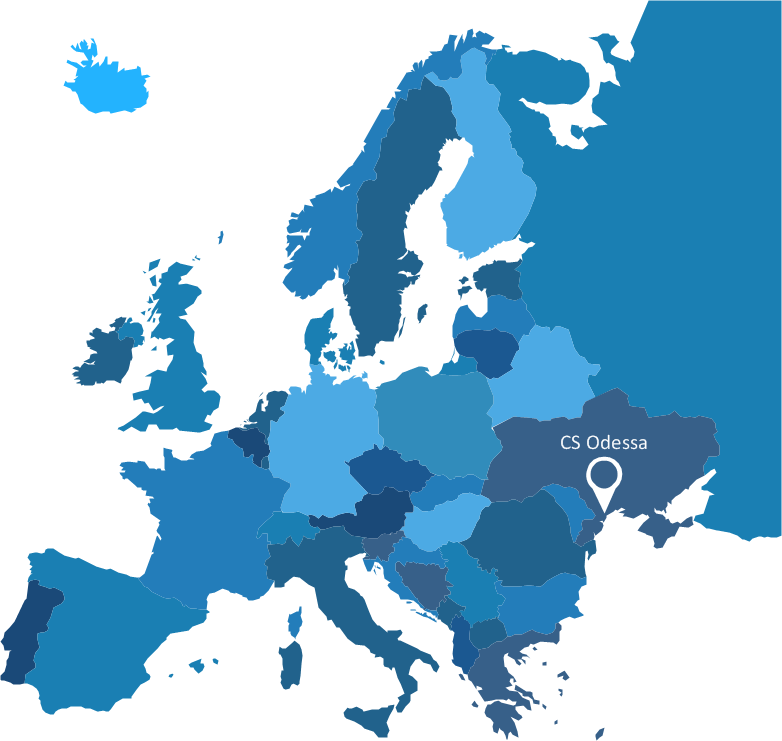
Picture: Map Infographic Creator
The program (or project) evaluation and review technique, commonly abbreviated PERT, is a statistical tool, used in project management, which was designed to analyze and represent the tasks involved in completing a given project. ConceptDraw DIAGRAM diagramming and vector drawing software extended with Seven Management and Planning Tools Solution from the Management Area offers the extensive drawing tools for effective drawing the PERT Chart of any complexity.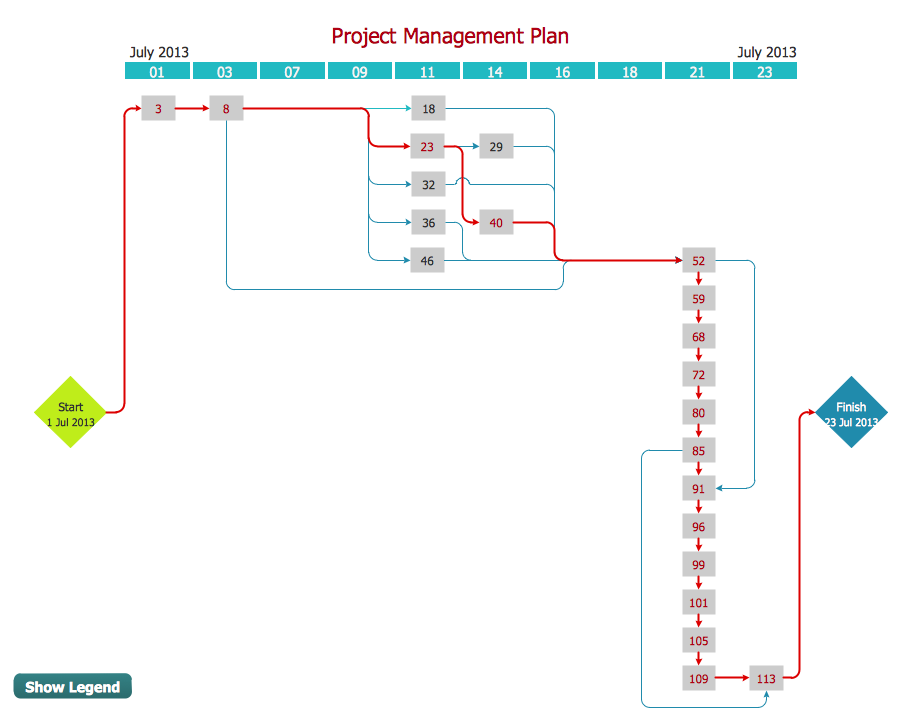
Picture: PERT Chart
Related Solution:
Use ConceptDraw DIAGRAM software with Flowcharts Solution to create Process Flow Charts, Flow Chart Process Maps, and High-Level Process Flow Charts to illustrate ✔️ high-level processes in industrial, chemical, and process engineering, ✔️ major plant processes, ✔️ minor details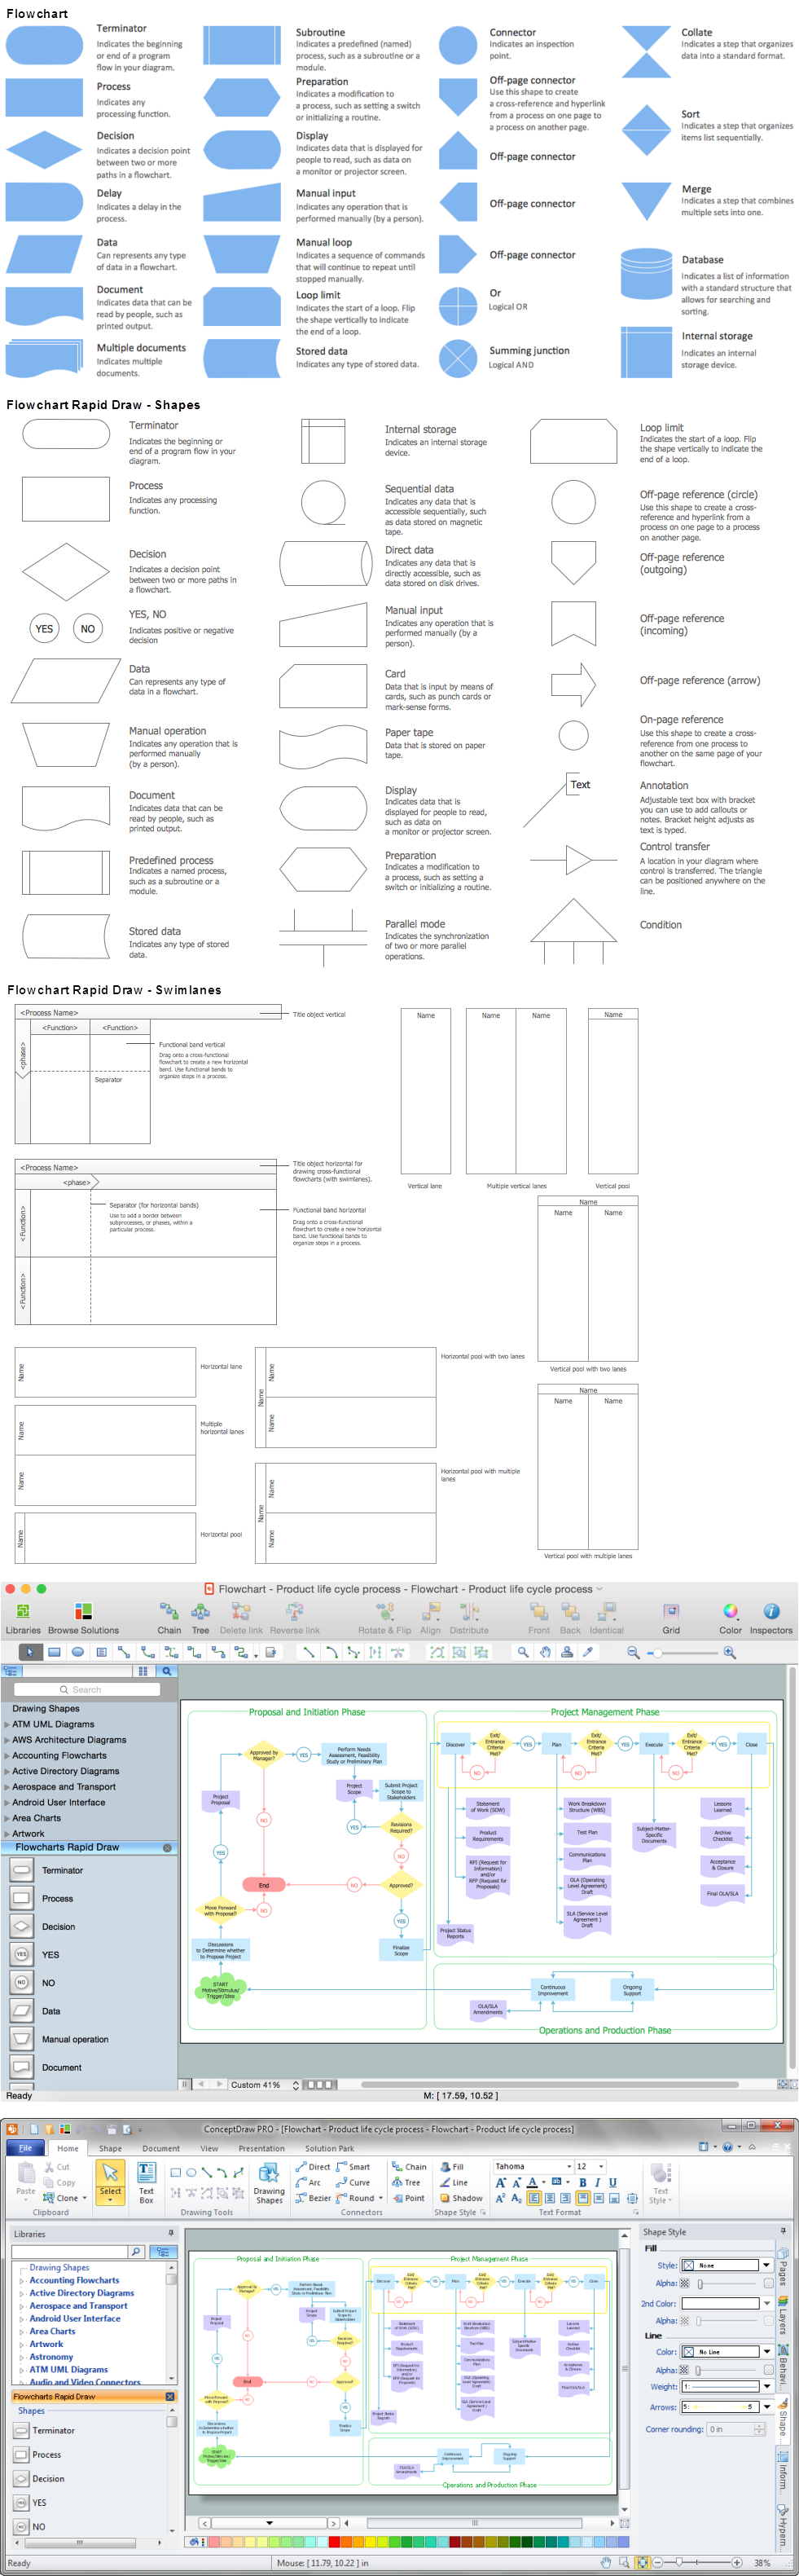
Picture: Process Flow Chart
Related Solution:
Over the past few centuries, data visualization has evolved so much that we use it every day in all areas of our lives. Many believe that infographic is an effective tool of storytelling, as well as analytics, and that it is able to overcome most of the language and educational barriers. Understanding the mechanisms of human perception will help you to understand how abstract forms and colors used in data visualization can transmit information more efficient than long paragraphs of text.
Picture: Tools to Create Your Own Infographics
Create flowcharts, org charts, shipping flowcharts, floor plans, business diagrams and more with ConceptDraw. Includes 1000s of professional-looking business templates that you can modify and make your own.
Picture: Basic Diagramming
Related Solution:
While developing software, it is very important to have a visual model, because it helps to represent the logic and the architecture of an application. Experienced engineers use UML diagrams to denote relationships between classes and their instances. UML is a general language for a set of diagrams like deployment diagrams, object diagrams or use case diagrams.
This diagram represents UML class diagram used for a software system development using an object-oriented method. Class diagrams are categorized as static structure diagrams that depict the physical structure of a system. Class diagram divides a software system's structure into "classes". Classes are defined by the methods and variables of objects. UML Class diagram is used to depict relationships and source code dependencies between objects.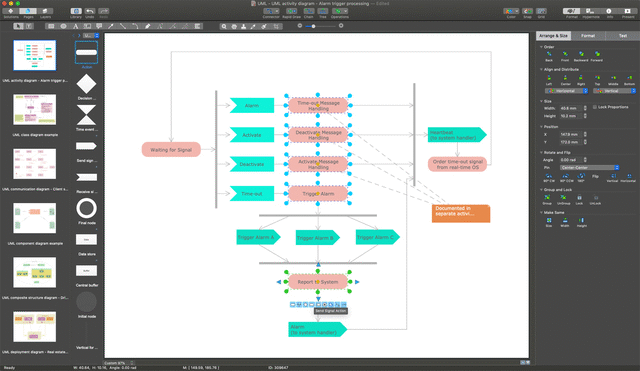
Picture: UML Diagram
Related Solution: