Bubble Chart Maker
In so many different fields of business activities, the diagrams, charts, flowcharts and schemes are an inalienable part of doing business and succeeding in what you do. For presentations, conferences or ordinary meetings it is always better to show what exactly you try to explain in the way of a drawing. This kind of drawing can be either a structured chart or a diagram as well as many other kinds and types of such schematics. Making charts is often simple, but they are very important in case you want other people (your colleagues, directors, clients, partners, etc.) to understand what you mean and to see the difference in numbers not only in a way of text and some chaotic set of numbers, but the exactly correct and right information which was structured in a way to be understandable.
One of so many different kinds of charts is so called “Bubble chart”. This kind of chart is very well known among those who deal with such drawings day by day and it is quite widely popular around the world as it is used in many spheres of different kinds of business and so very useful. With the help of this particular kind of chart you can illustrate three different dimensions of some data. Each of the entities with its triplet of associated data is plotted as a disk, which expresses two of the values of the first entity through the disk's xy location, and the third - through its size. Using bubble charts can facilitate the understanding of social, medical, economical and other scientific relationships for your partners, clients, co-workers, employees, etc.
Basically the data points which you want to use for your chart are presented in a way of bubbles which makes it obvious to understand the difference between different elements or entities as so their size and value. The quantity of the data points, or the entities, can vary and, depending on how many different numbers you want to mention, the size of each chart can vary too.
Bubble charts can remind you of another type of charts which is so called “Scatter chart”. In case your data has three data series and each of them contains a particular set of values, then you can use the bubble chart instead of the scatter one. In each bubble chart the sizes of the bubbles themselves are determined by the values in the third data series.
Thinking about trying to make such kind of chart for the first time in your life or intending to create the one using the new, better software, we can recommend you to use ConceptDraw DIAGRAM application as only this software allows you to choose from so many solutions which can be helpful to make of the needed chart as well as many of them. The more solutions you download, the more tools you get and so the more chances of creating what you need, using all of the available symbols and templates from these solutions.
To be able to create any of the needed and planned bubble charts within a very short period of time, you definitely need the software, with help of which you can create any chart, including the bubble one, and it should be ConceptDraw DIAGRAM application. Getting it as well as the one called ConceptDraw STORE, can help you to solve all of your problems in drawing charts, flowcharts, schemes, plans, diagrams and maps. Having ConceptDraw STORE which you can use for working in ConceptDraw DIAGRAM having all of the solutions available to be downloaded any time you need means having all of the necessary tools for creating great looking charts, including the bubble charts.
Downloading ConceptDraw DIAGRAM diagramming and vector drawing software extended with Business Diagrams Solution, which can be found in the Management Area on this site or in ConceptDraw STORE means getting a very powerful Bubble Chart Maker as well as other types of charts maker and using it for creating these charts within only a couple of hours or even minutes, depending on how good you are with such applications. Although if you do not have any experience in using ConceptDraw DIAGRAM then you can get used to it very quickly with the aid of our support team and the articles on this site about making different charts, flowcharts, schemes, diagrams, maps and plans. Also you can always find the videos on our Youtube channel which can explain the way this useful software works as well as how unique ConceptDraw DIAGRAM is.
Having solutions, such as Business Diagrams Solution, means having all of the necessary tools for making your drawings, instead of creating your own design elements which can take too much time. Do not waste time anymore, get the pre-designed elements from the stencil libraries as well as previously made samples and templates in order to create your bubble diagrams and charts.
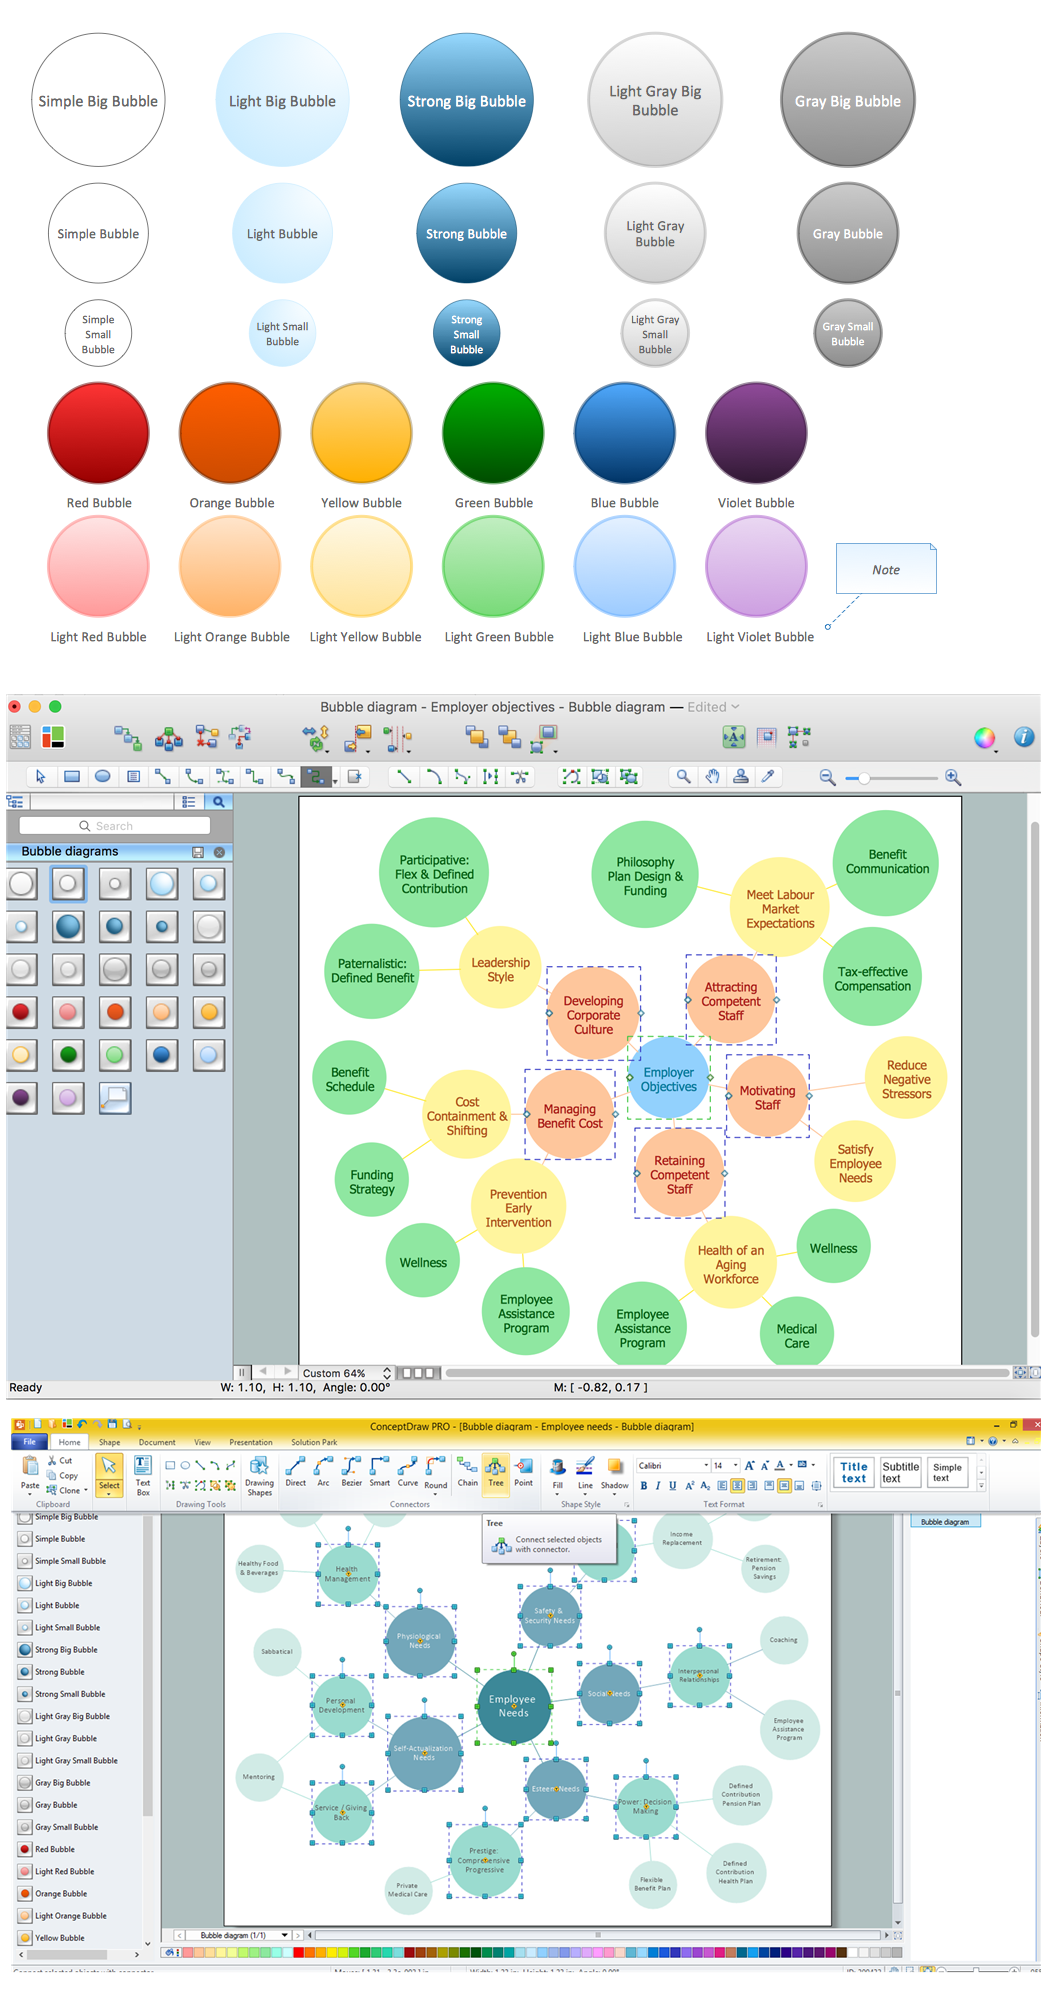
Business Diagrams Solution offers the extensive drawing tools, such as a Bubble Diagrams Library with 28 vector shapes, such as Simple Big Bubble, Simple Bubble, Simple Small Bubble, Light Blue Bubble, Light Bubble, Light Small Bubble, Strong Big Bubble, Strong Bubble, Strong Small Bubble, Light Grey Big Bubble, Light Grey Bubble, Light Grey Small Bubble, Grey Big Bubble, Grey Bubble, Grey Small Bubble, Red Bubble, Orange Bubble, Yellow Bubble, Green Bubble, Blue Bubble, Violet Bubble, Light Red Bubble, Light Orange Bubble, Light Yellow Bubble, Light Green Bubble, Light Blue Bubble, Light Violet Bubble, etc.
The CS Odessa team of IT specialists who created ConceptDraw DIAGRAM software offers a wide range of capabilities for successful process of designing and so great result of a Bubble Diagram. ConceptDraw DIAGRAM software allows you to accentuate the importance of some ideas by the bubble size or colour. You can always also variate the colour intensity of each bubble on your bubble chart or bubble diagram.
Having Business Diagrams Solution which you can use while working in ConceptDraw DIAGRAM on making a great looking, as well as smart and professionally looking, Bubble diagram, means achieving the needed result only within a couple of hours or even minutes as this solution also provides with the set of templates and samples for quick and simple drawing of Bubble Charts of any complexity.

Example 1. Bubble Chart Maker
Business Diagrams Solution offers the extensive drawing tools, a Bubble Diagrams Library with 28 vector shapes, and also the set of templates and samples for quick and easy drawing the Bubble Charts of any complexity.
Example 2. Bubble Diagrams Library Design Elements
ConceptDraw DIAGRAM software offers wide capabilities for successful Bubble Diagram design. It lets you accentuate the importance of some ideas by the bubble size or color, you can also variate by color intensity of bubble chart levels.
Example 3. Bubble Chart - Page Rank
The following features make ConceptDraw DIAGRAM the best Bubble Chart Maker:
- You don't need to be an artist to draw professional looking diagrams in a few minutes.
- Large quantity of ready-to-use vector objects makes your drawing diagrams quick and easy.
- Great number of predesigned templates and samples give you the good start for your own diagrams.
- ConceptDraw DIAGRAM provides you the possibility to use the grid, rules and guides. You can easily rotate, group, align, arrange the objects, use different fonts and colors to make your diagram exceptionally looking.
- All ConceptDraw DIAGRAM documents are vector graphic files and are available for reviewing, modifying, and converting to a variety of formats: image, HTML, PDF file, MS PowerPoint Presentation, Adobe Flash, MS Visio.
- Using ConceptDraw STORE you can navigate through ConceptDraw Solution Park, managing downloads and updates. You can access libraries, templates and samples directly from the ConceptDraw STORE.
- If you have any questions, our free of charge support is always ready to come to your aid.


