
Pic.1. ConceptDraw DIAGRAM software for event-driven process chain (EPC) diagrams.
The Event-driven Process Chain Diagrams provides templates, samples and libraries with large quantity of vector objects to help you create the EPC diagrams of any difficulty in a few minutes.

Pic.2. Car wash service EPC diagram.
The Event-driven Process Chain (EPC) diagrams produced with ConceptDraw DIAGRAM are vector graphic documents and are available for reviewing, modifying, converting to a variety of formats (image, HTML, PDF file, MS PowerPoint Presentation, Adobe Flash or MS Visio), printing and send via e-mail in one moment.
TEN RELATED HOW TO's:
The innovative ConceptDraw Arrows10 Technology included in ConceptDraw DIAGRAM is a powerful drawing tool that changes the way diagrams are produced.
While making the drawing process easier and faster.
This is more than enough versatility to draw any type of diagram with any degree of complexity.
Picture: How to Dramatically Reduce Drawing Time - New connection modes
The vector stencils library COM and OLE from the solution Software Engineering contains 15 symbols of the COM and OLE objects for ConceptDraw DIAGRAM software.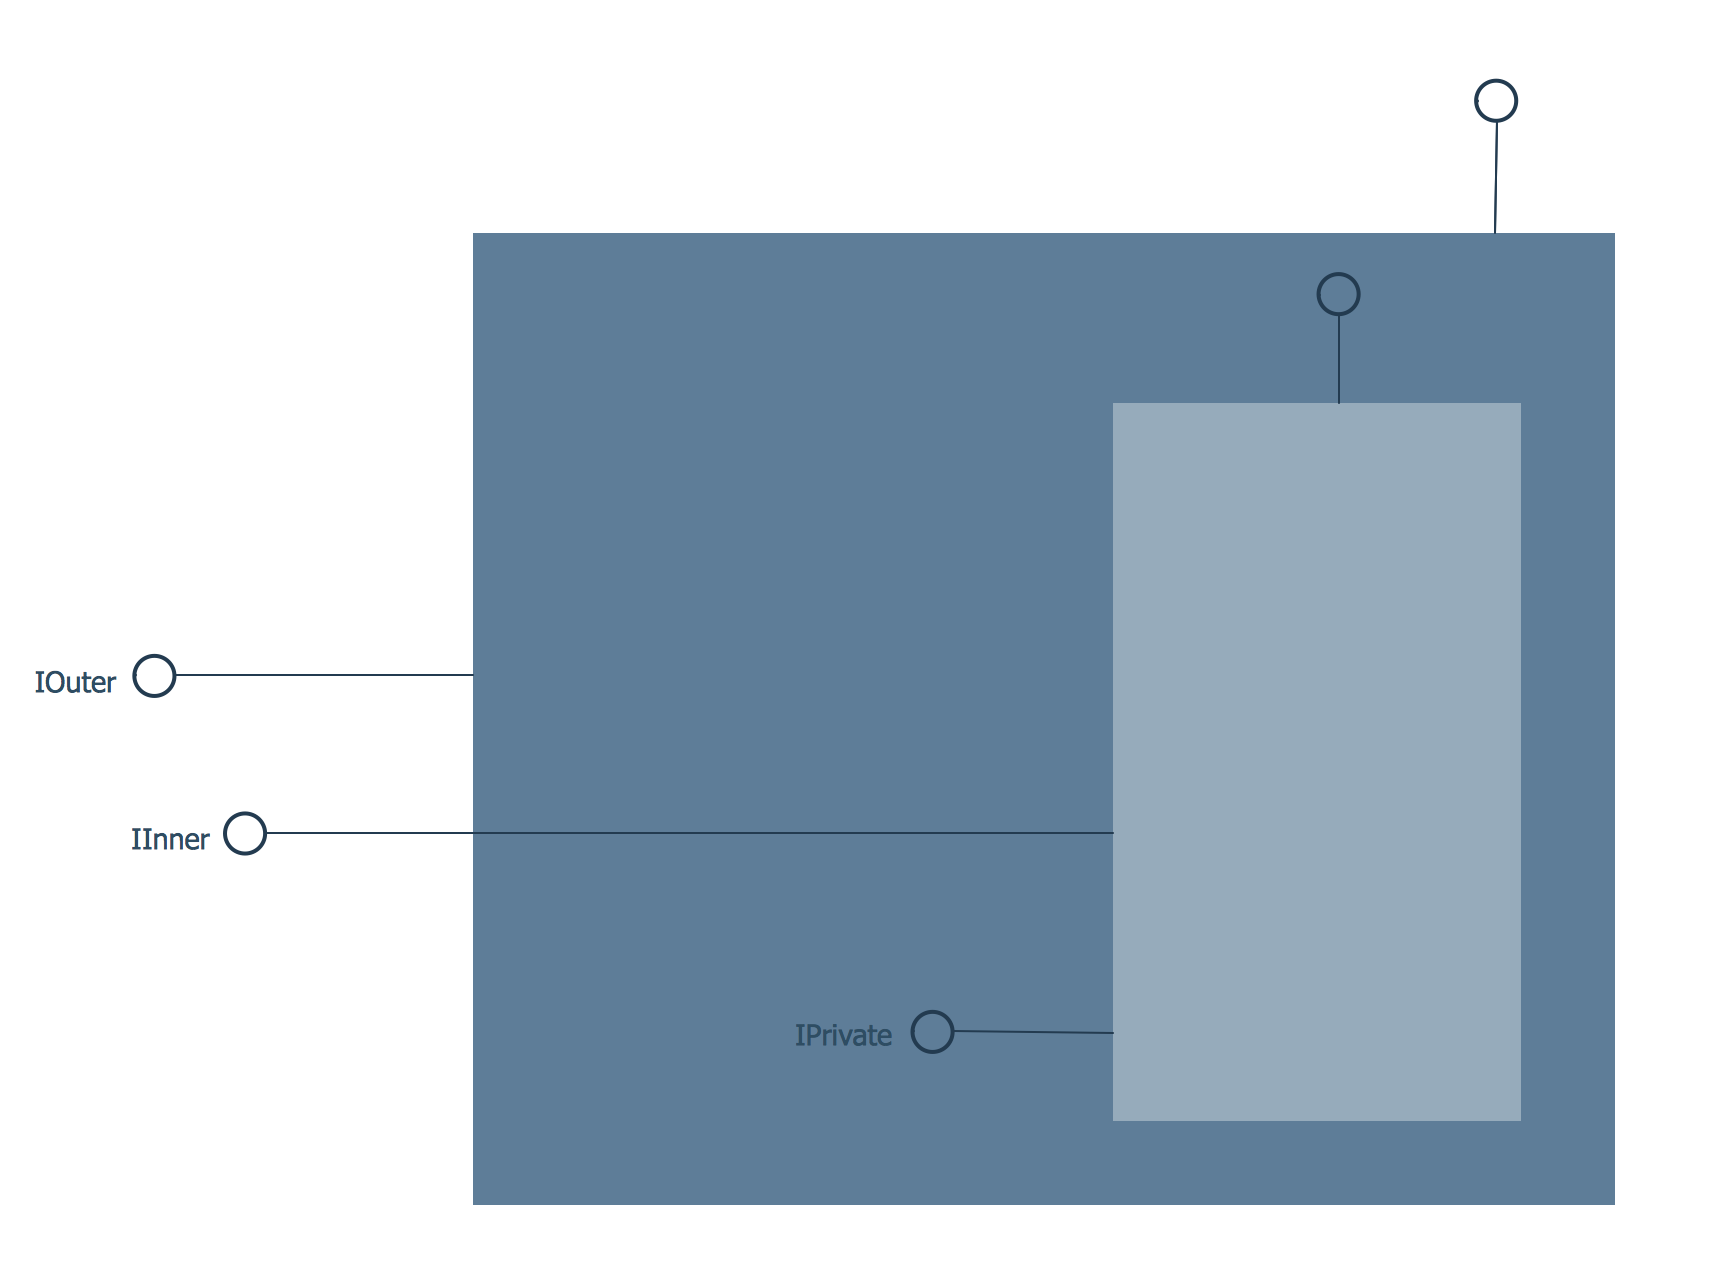
Picture: COM and OLE Diagram
How to design a Bubble Chart? It’s very easy! All that you need is a powerful software. Never before creation of a Bubble Chart wasn’t so easy as now with tools of Business Diagrams Solution from the Management Area for ConceptDraw Solution Park.
Picture: Bubble Chart
Related Solution:
How should diagramming software work? Is it possible to develop a diagram as quickly as the ideas come to you? The innovative ConceptDraw Smart Connectors Technology - This is more than enough versatility to draw any type of diagram with any degree of complexity.
Connection points are necessary for diagramming network, flowchart and organizational charts. In ConceptDraw you connect shapes by attaching, or snapping and gluing, connectors to shape connection points.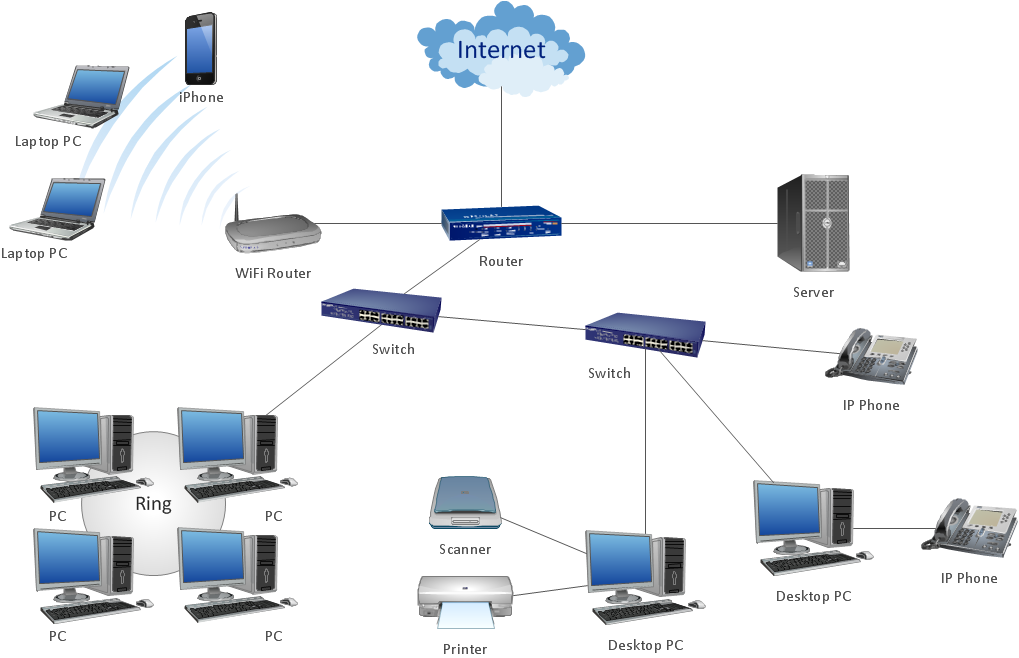
Picture: ConceptDraw Arrows10 Technology
Do you like infographics and data visualization? Creating infographics is super-easy with ConceptDraw.
Picture: Winter Sports. Olympic Games Illustrations. Medal Summary
Related Solution:
For those who want to know what is a cross functional flowchart and how to draw it, we preared a special library and professional looking templates.
Take all the advantage of your drawing software to learn and create such a well-designed flowcharts.
Watch the HowTo video to learn more.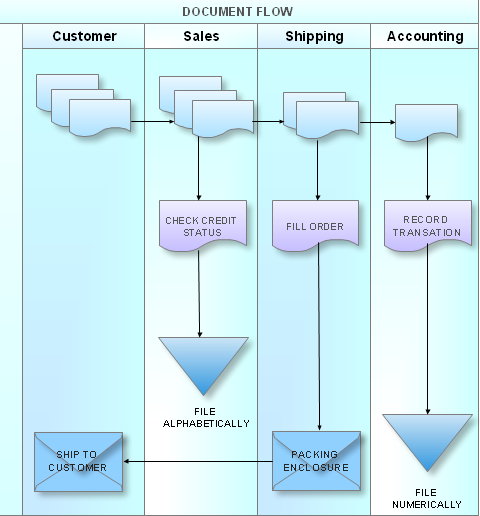
Picture: What is a Cross Functional Flow Chart?
During the planning, discussing and execution of a project you may need to prepare a presentation using project views such as the Gantt Chart, Multiproject Dashboard or Resource Usage View. It’s easy do with ConceptDraw PROJECT!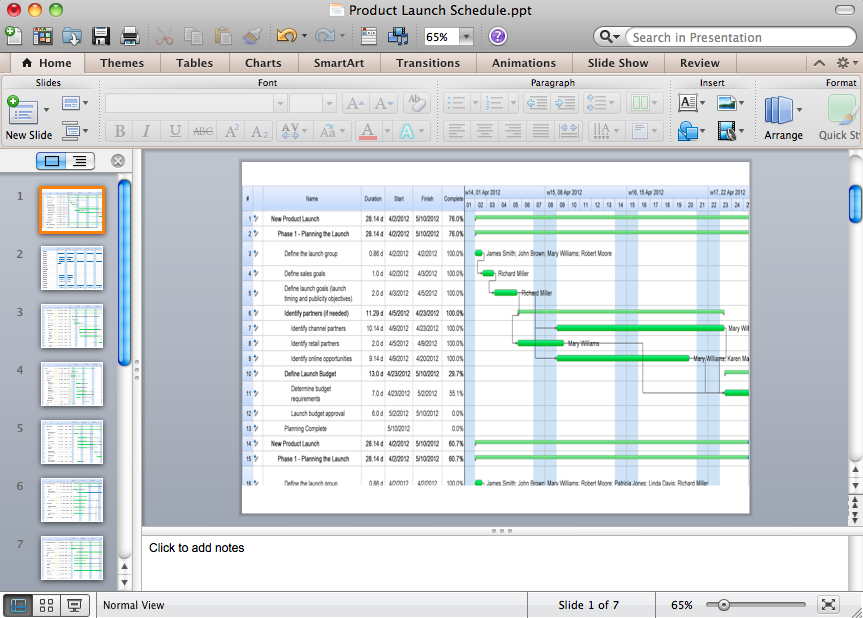
Picture: How to Create Presentation of Your Project Gantt Chart
The vector stencils library United Kingdom contains contours for ConceptDraw DIAGRAM diagramming and vector drawing software. This library is contained in the Continent Maps solution from Maps area of ConceptDraw Solution Park.
Picture: Geo Map - Europe - United Kingdom
Related Solution:
Learn the most common process flowchart symbols used in business process diagrams and workflow charts. Includes symbol meanings, examples, and a practical reference table.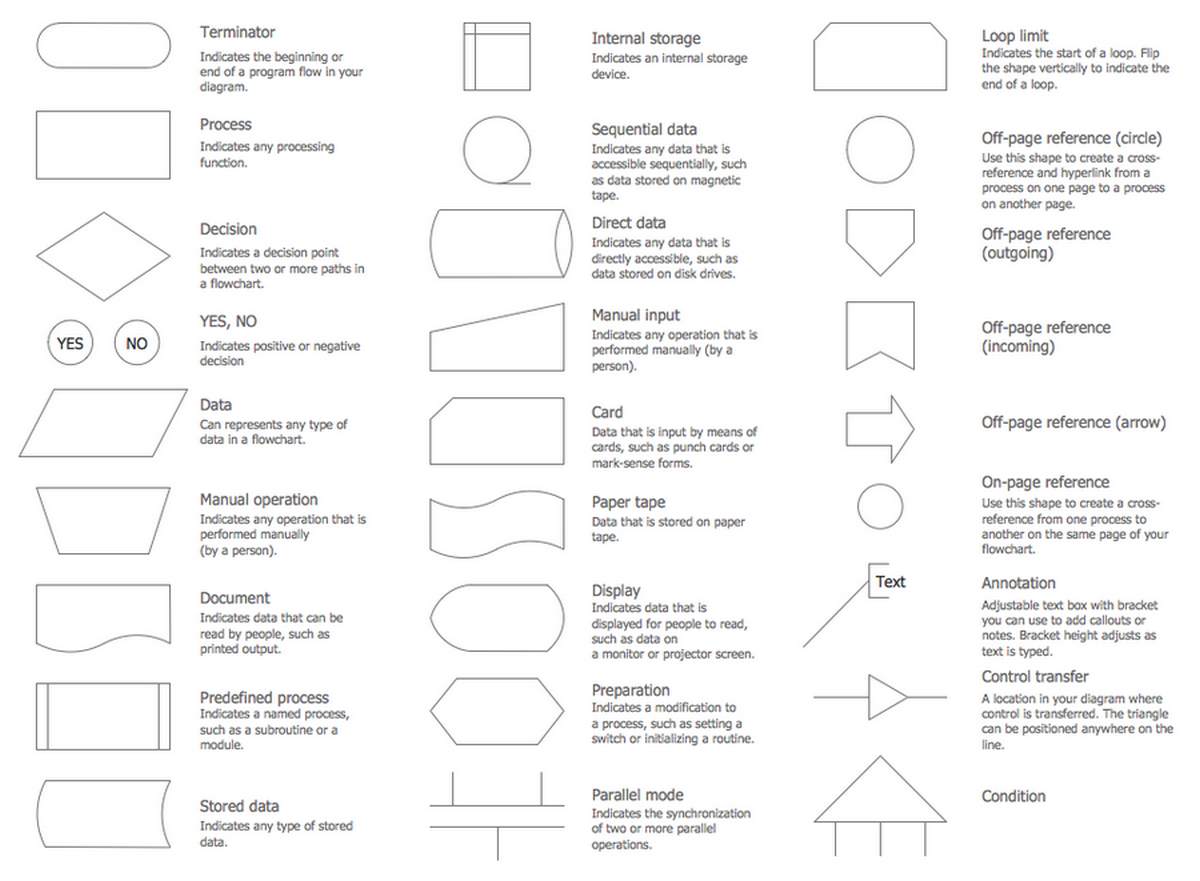
Picture: Process Flowchart Symbols: Meaning, Types and Examples
Related Solution:
If you need to pull together a quick marketing drawing, you'll find elements, samples, templates and libraries with vector clip art for drawing the Marketing Illustrations.
These symbols and signs you can use in your design for Strategic Marketing, Graphic Design, Inbound and Content Marketing, Social Media, Lead Generation, Email Marketing and Automation, CRM implementation and Integration and more.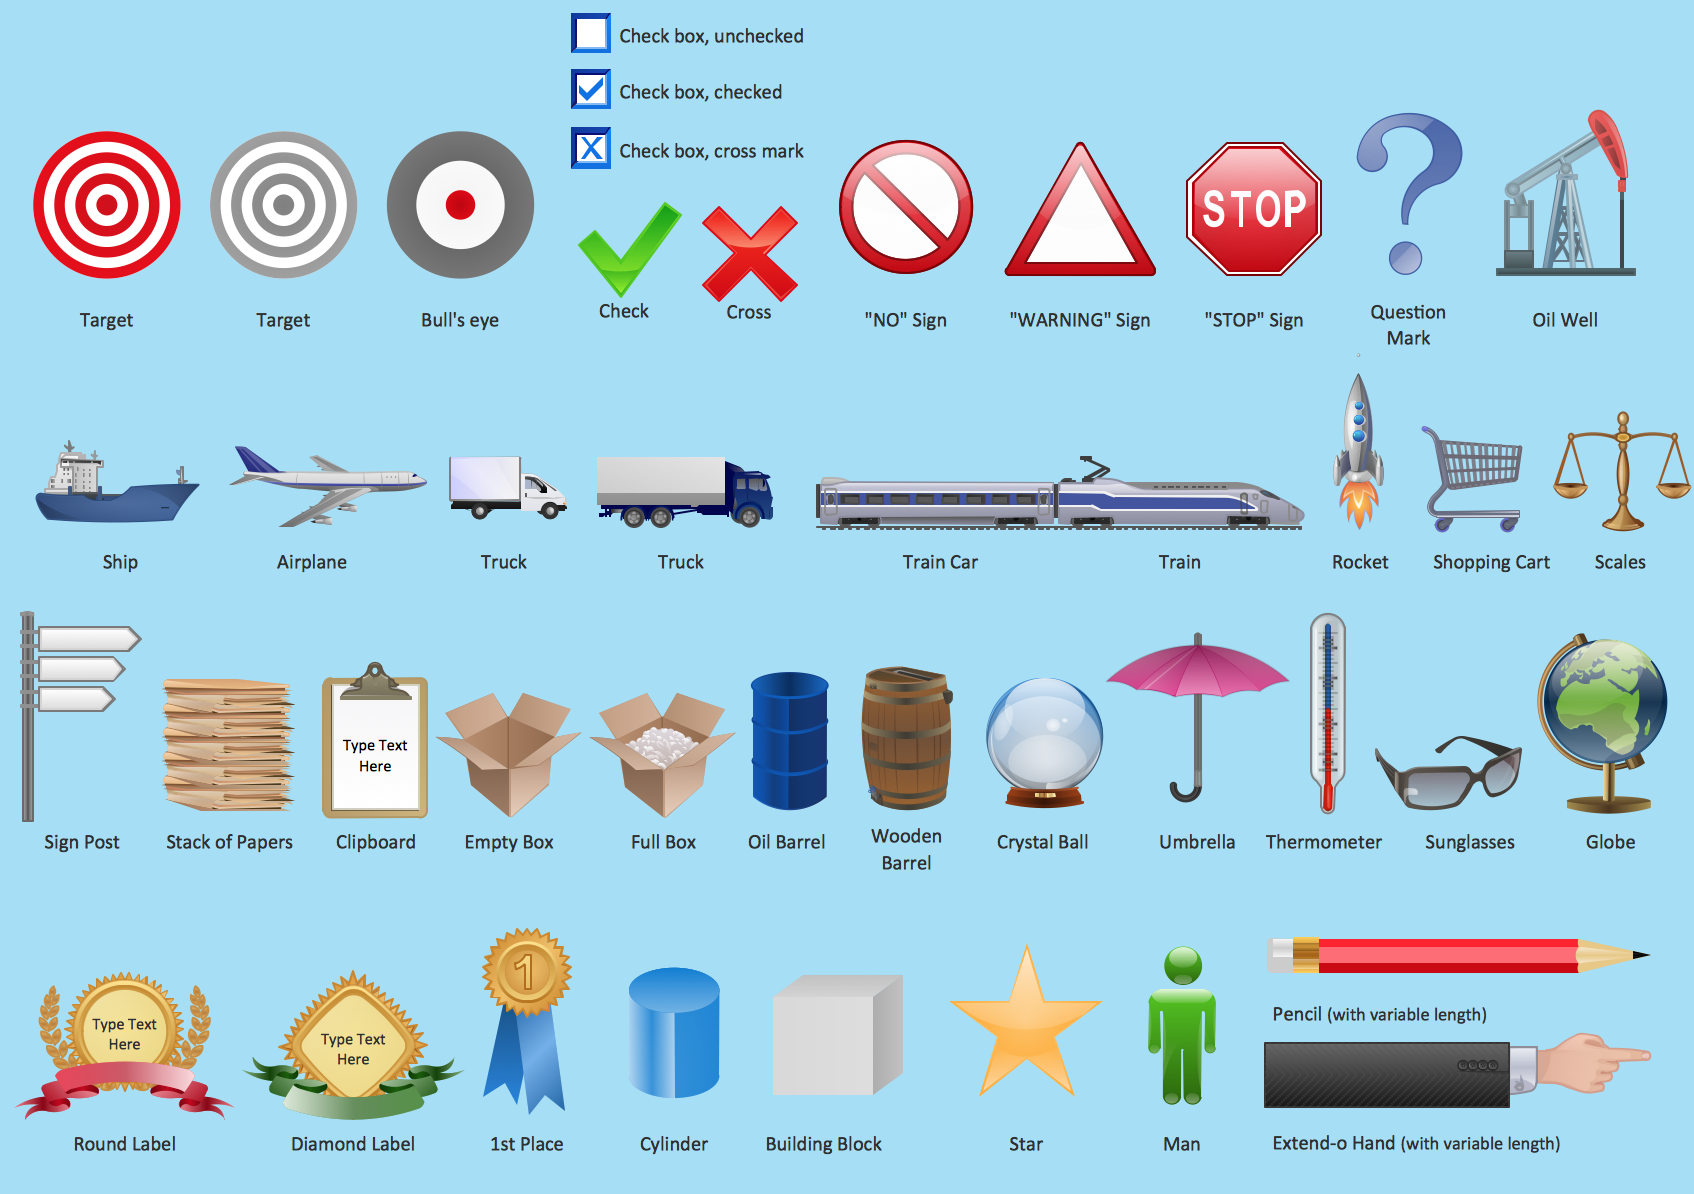
Picture: Marketing - Design Elements
Related Solution: