Gant Chart in Project Management
|
— a full-featured project management solution with all the necessary functions right at your fingertips. Generates an extensive variety of reports on project and task statuses. Centralizes project information through embedded documents and hyperlinks. Unique Multiproject Dashboard manages multiple projects from a single file. Powerful integration with other ConceptDraw products makes project management easier than ever before.
Gant Chart is a graphical representation of tasks as segments
on a time scale. It helps plan and monitor project development or resource
allocation. The left hand side of the Gant chart is a column with lists
of tasks. The horizontal axis is a time scale, expressed either in absolute
or relative time.
|
|
|
In a Gant chart, each task takes up one row. Dates run along the
top in increments of days, weeks or months. Rows of bars in the
Gant chart show the start and end dates of each task in the project.
Tasks may run sequentially, in parallel or overlapping.
Download free trial of Gant Chart drawing software
|
Gant chart example
Use Gant chart at project scheduling
stage to
- Assess time characteristics to a project
- Show the task order
- Define resources involved
- Show links between scheduled tasks
|
|
Tip using Gant Chart |
|
For large projects, tasks can be
split into subtasks with own Gant charts to maintain
readability.
|
|
Use Gant chart at project planning stage to
- Monitor project completion
- Display the results of correctional activities
- Show links between scheduled tasks
|
|
Mac Gant chart screenshot |
|

|
|
Useful Gant Chart links
| History of a Gant Chart |
Gant chart was created by Henry L. Gant,
an American engineer, in 1917. He developed the first Gant chart
for planning of building ships in the First World War times. The
chart proved to be such a powerful analytical instrument that
it had not undergone any changes for almost 100 years. It was
only in 90s of the last century when link lines between tasks
were added to the Gant chart.
|
|

Addendum: Gantt Spelling
Widely discussed, but difficult to spell, and far more than a buzzword, Gantt's unusual surname gives rise to much dismay
as people search for information on Gant Charts, Ghant Charts, and Gannt Charts. As such, I have included these common misspelling.
Gant Chart :
Gant Chart for project planning and scheduling :
Usage of Gant Charts :
History of a Gant Chart :
Gant Chart examples :
Gant chart software download :
More on Gant Charts :
Project Management Tool :
Gant Chart :
Buy Gant Chart
NINE RELATED HOW TO's:
ConceptDraw PROJECT delivers a rich set of built-in functionalities and optional product extensions that support your daily workflow in time-saving and creative ways. This video lesson will teach you how to work with costs in your project document.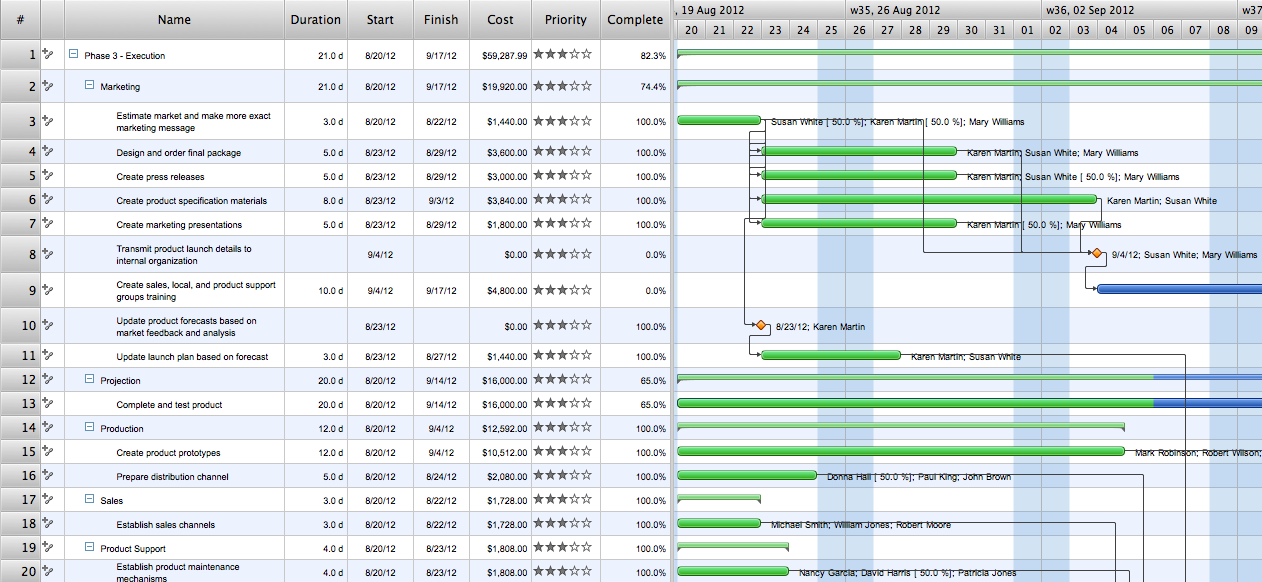
Picture: Project — Working With Costs
Chore chart. Draw perfect-looking chore chart. Free chore chart samples. All about chore charts.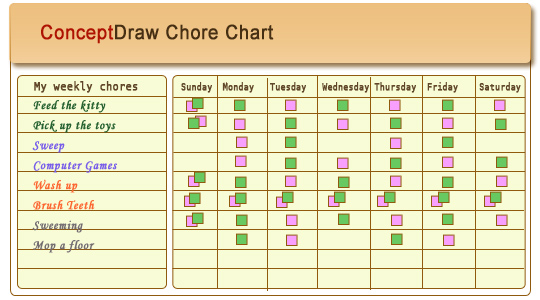
Picture: Chore charts with ConceptDraw DIAGRAM
This sample shows the Business Process Reengineering Diagram. Reengineering is the process of the business processes optimizations. This sample can be used in business process management, quality management, project management and program management.
Picture: Business Process Reengineering Examples
Related Solution:
ConceptDraw DIAGRAM diagramming and vector drawing software extended with Marketing Diagrams Solution from the Marketing Area of ConceptDraw Solution Park is the best software for quick and easy creating Marketing Flow Chart of any complexity and design.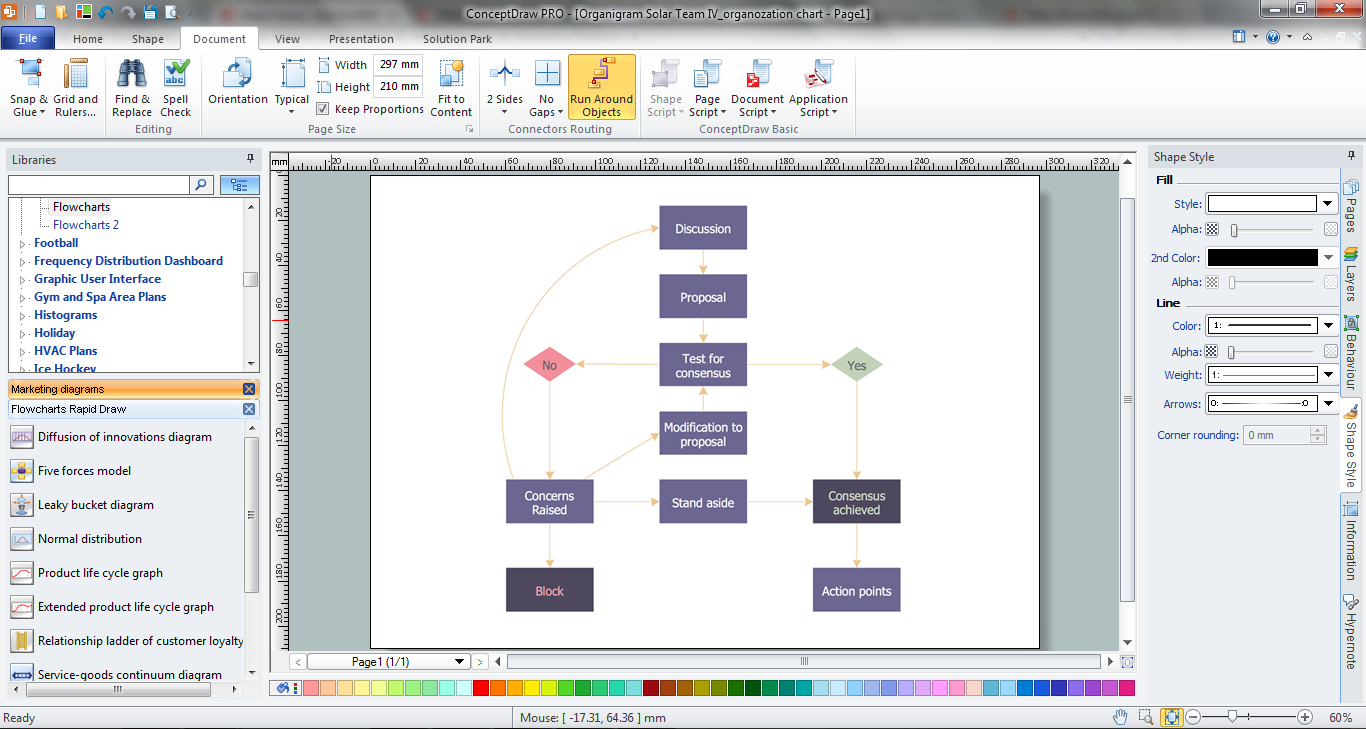
Picture: Marketing Flow Chart
Related Solution:
When we think of an hierarchy, we intuitively imagine a pyramid. Thus, a lot of management tools use pyramid charts as examples or illustrations of various documents or models. You can create any type of triangle diagram using ConceptDraw DIAGRAM.
A triangle (pyramid) diagram is often used in marketing to show the data hierarchy. This pyramid diagram represents the Top Brand Model. It illustrate the model of rebranding strategy. It can be used by marketing agency dealing with rebranding strategies development. It’s critical for marketing diagrams to be both clear and eye catching. ConceptDraw Pyramid diagrams solution meet all these requirements and can be successfully applied for creating and presenting various marketing pyramidal diagrams.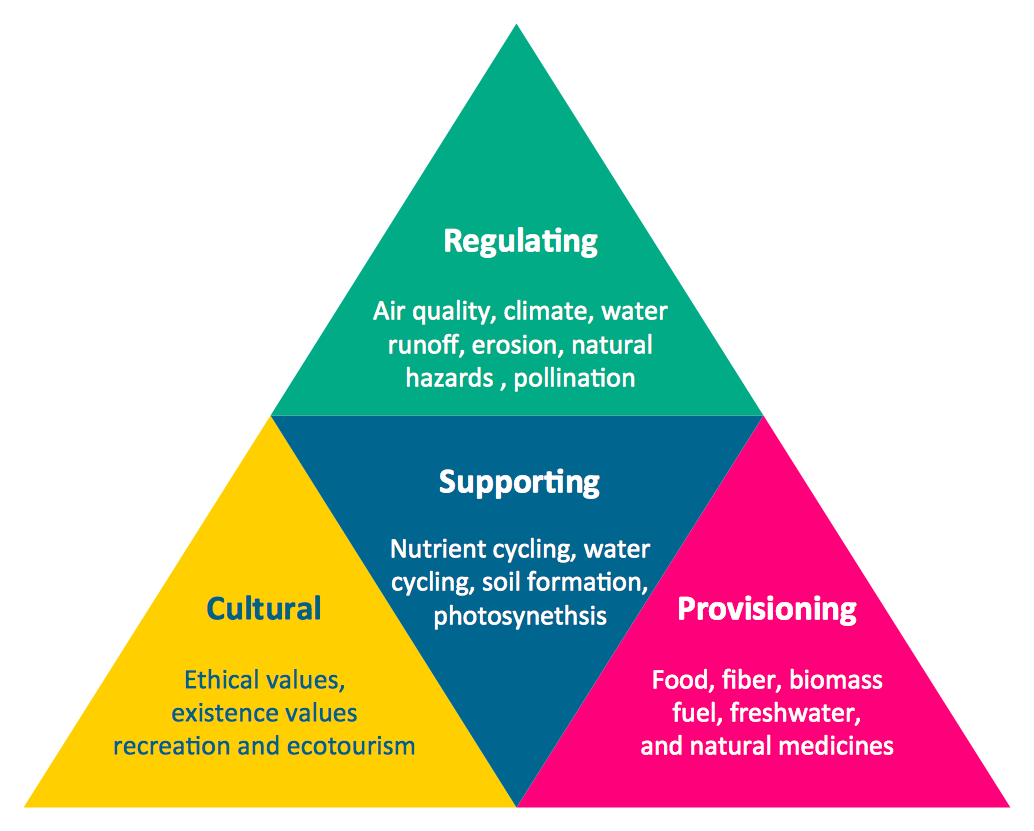
Picture: Pyramid Chart Examples
Related Solutions:
Separated into categories of Basic, Intermediate, and Advanced categories, the new instructional videos about ConceptDraw PROJECT cover a huge breadth of topics. Users new to ConceptDraw PROJECT will find the Basic lessons an essential platform for familiarizing themselves with the programs′s functions. This video lesson is the first in Basic lessons series.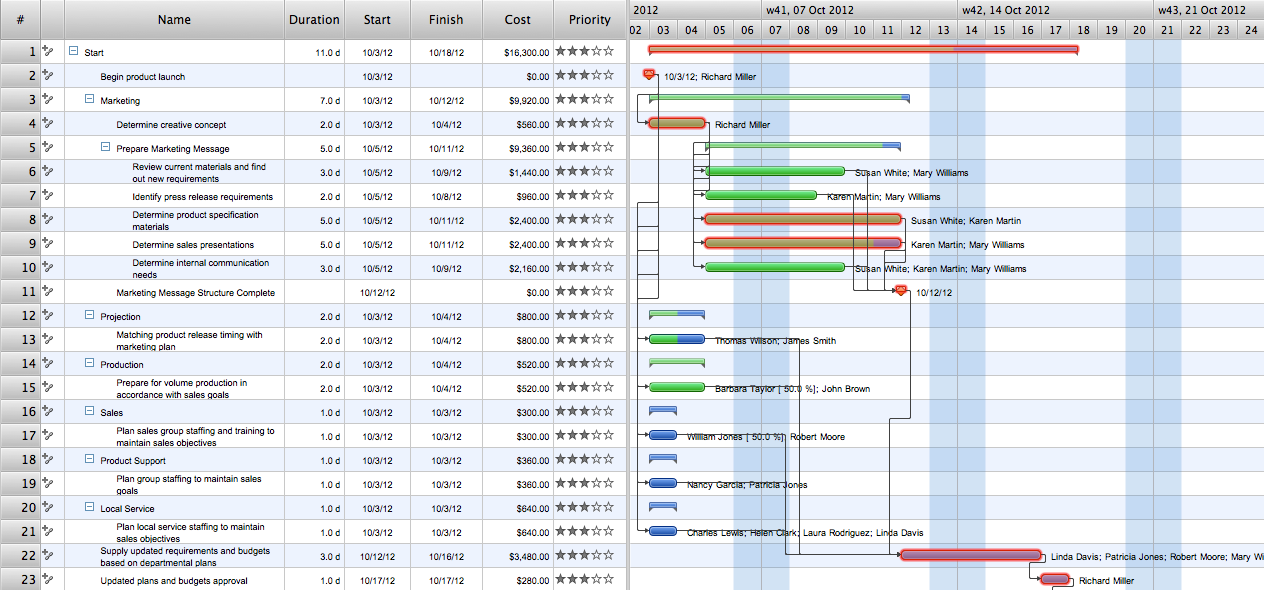
Picture: What Constitutes a Project?
The arrangement of tables and seating charts near them have great value in many premises and situations. It is often very convenient to draw a plan before the furniture arrangement. ConceptDraw DIAGRAM software offers the Seating Plans solution from the Building Plans area for fast and easy drawing the table seating chart template and samples.
Picture: Table Seating Chart Template
Related Solution:
The PERT Chart is constructed as part of the process in creating a schedule of corrective actions. The PERT Chart shows the logical connections and consequence of tasks to be performed. It displays the time period for problem solving and the implementation of all activities through the critical path.
ConceptDraw Office suite is a software for corrective actions planning.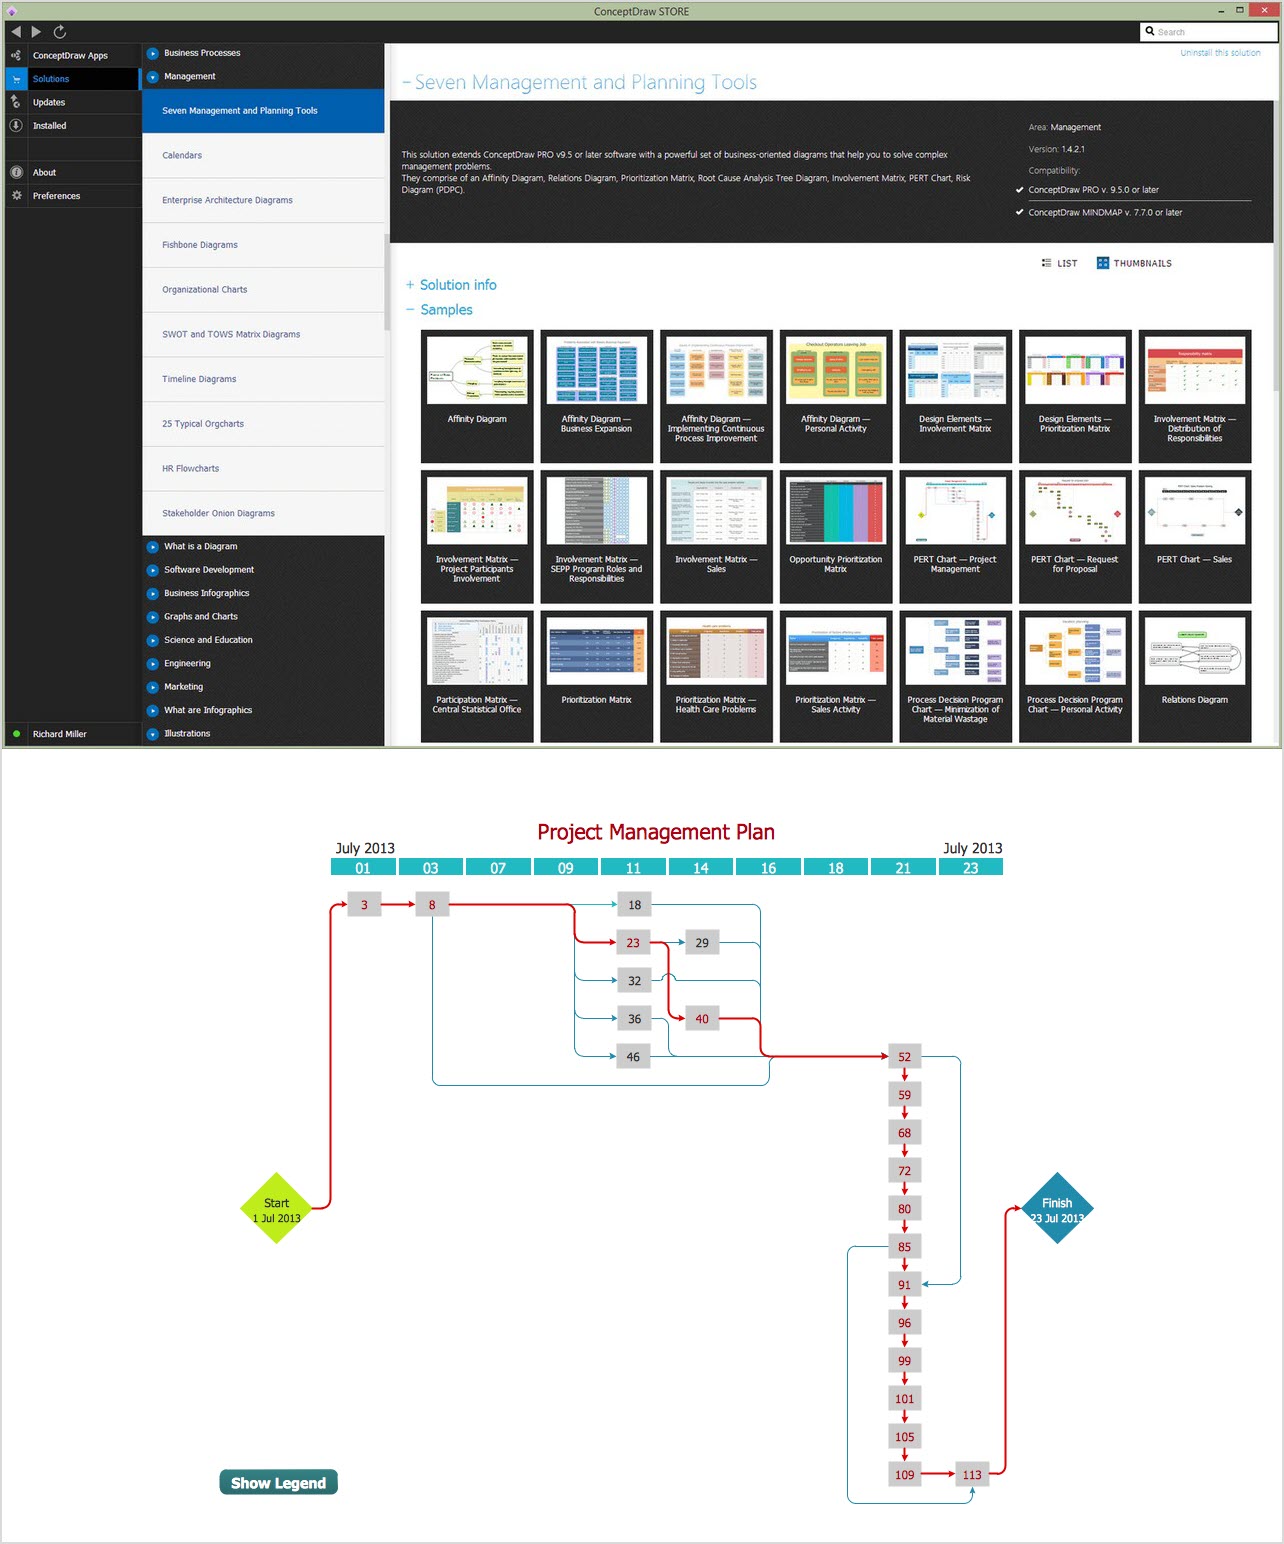
Picture: CORRECTIVE ACTIONS PLANNING. PERT Chart
ConceptDraw PROJECT is a vigorous tool for managing single or multiple projects. It lets you determine all essential elements involved into project, control schedules, resources and finances, and monitor projects' progress in most effective yet simple manner.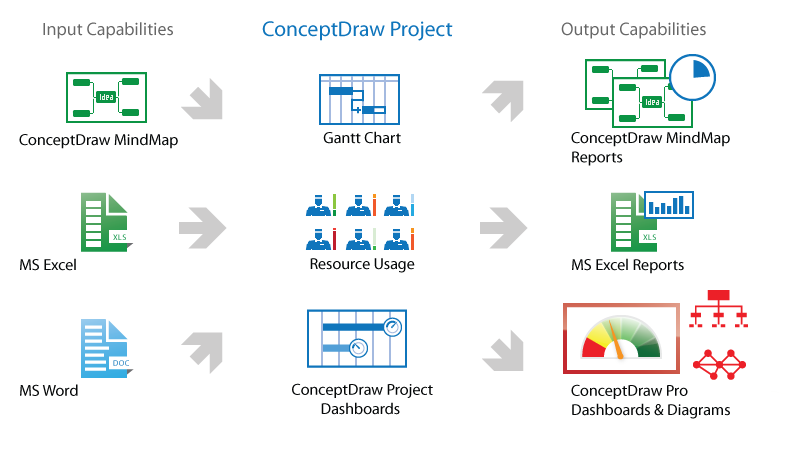
Picture: Product Overview

