Infographic Generator
ConceptDraw DIAGRAM extended with Typography Infographics Solution from the “Infographics” Area is the best Infographic Generator. Make sure in it right now!
Typography Infographics Solution offers you the best numerous collection of predesigned infographics examples and 9 libraries:
- Arrowed Text Blocks
- Bulleted and Numbered Lists
- Callout
- Labels
- Numbers
- Tabbed Text Blocks
- Tables
- Text Blocks
- Titles
with large quantity of ready-to-use vector stencils that will help you design your own Typography Infographics of any complexity in minutes.

Example 1. Typography Infographics — Labels Design Elements
Simply drag the needed objects from the libraries to save your time and create typography graphic quick and easy.
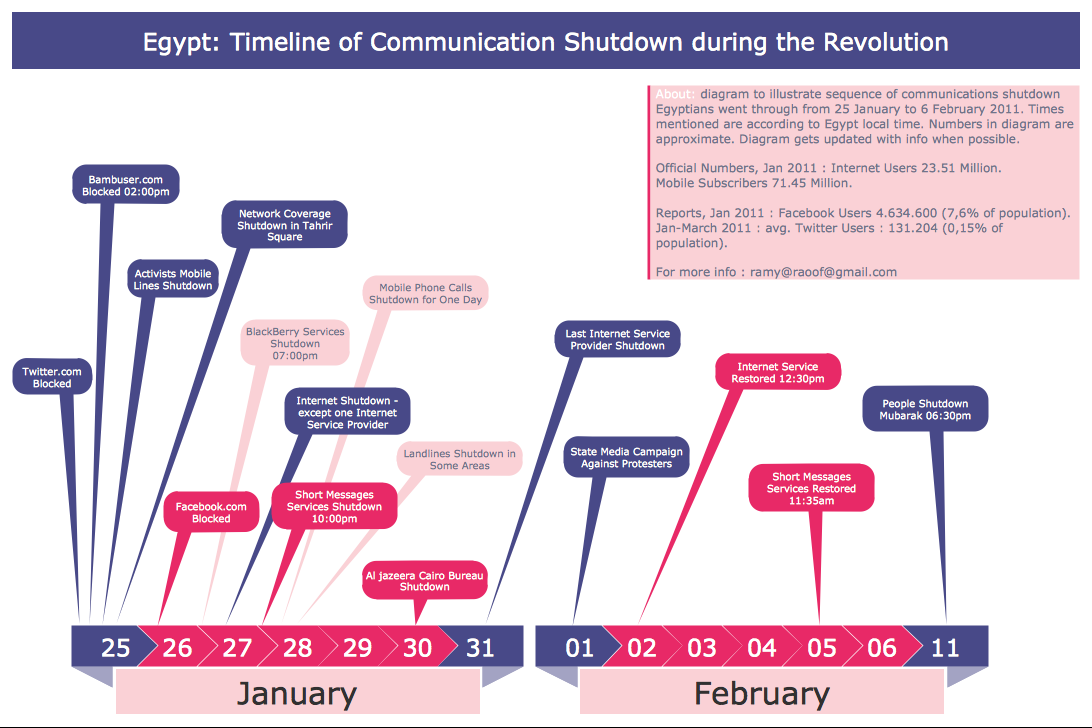
Example 2. Infographic Generator — Egypt Timeline of Communication Shutdown
This sample was created in ConceptDraw DIAGRAM infographic generator using the Typography Infographics Solution from the “Infographics” Area and shows the sequence of Communication Shutdown in Egypt in 2011. Use of callouts is an excellent way for arranging large quantity of information or useful data on the relatively small typography graphic. An experienced user spent 15 minutes creating this sample.
Use the Typography Infographics Solution for ConceptDraw DIAGRAM infographic software to create your own professional looking and attractive Typography Infographics of any complexity quick, easy and effective.
All source documents are vector graphic documents. They are available for reviewing, modifying, or converting to a variety of formats (PDF file, MS PowerPoint, MS Visio, and many other graphic formats) from the ConceptDraw STORE. The Typography Infographics Solution is available for all ConceptDraw DIAGRAM or later users.
TEN RELATED HOW TO's:
There are numerous articles about the advantages of flowcharting, creating business graphics and developing different charts. Nevertheless, these articles are almost useless without the main component - the examples of flowcharts, org charts and without a fine example, it is difficult to get all the conveniences of creating diagrams. You can find tons of templates and vivid examples on Solution Park.
This illustration shows a variety of business diagrams that can be created using ConceptDraw DIAGRAM. It comprises a different fields of business activities: management, marketing, networking, software and database development along with design of infographics and business illustrations. ConceptDraw DIAGRAM provides a huge set of sample drawings including business process modeling diagrams,, network diagrams, UML diagrams, orgcharts, DFD, flowcharts, ERD, geographical maps and more.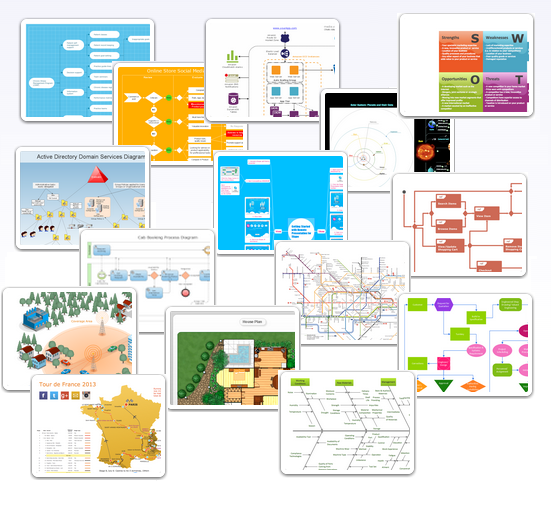
Picture: Examples of Flowcharts, Org Charts and More
Related Solution:
ConceptDraw DIAGRAM diagramming and vector drawing software extended with Concept Maps Solution from the Diagrams Area is a powerful Concept Map Maker.
Picture: Concept Map Maker
Related Solution:
Infographic is a visual way of representing various information, data, knowledge in statistics, geography, journalism, education, and much more areas. ConceptDraw DIAGRAM supplied with Pictorial Infographics Solution from the “Infographics” Area, provides a set of powerful pictorial infographics tools. Thanks to them it is the best Infographic Maker.
Picture: Infographic Maker
Related Solution:
Big and complex projects sometimes need some simplification of plans and schedules. That's why Program Evaluation and Review Technique was invented and first implemented in 1958. You can create PERT diagrams effortlessly with ConceptDraw DIAGRAM and share them with your colleagues.
Program Evaluation Review Technique (PERT) is a method that is used to assess and analyze projects. PERT is a valuable tool for the project management practice. PERT gives an assessment and analysis of the time needed to the project completion. A PERT chart is a visual tool that delivers a graphical view of a project timeline. It is used to display the sequences and dependences of project tasks necessary to complete a project. ConceptDraw DIAGRAM delivers the possibility to build a PERT along with other diagrams applied to assist management process by using its Seven Management and Planning Tools solution.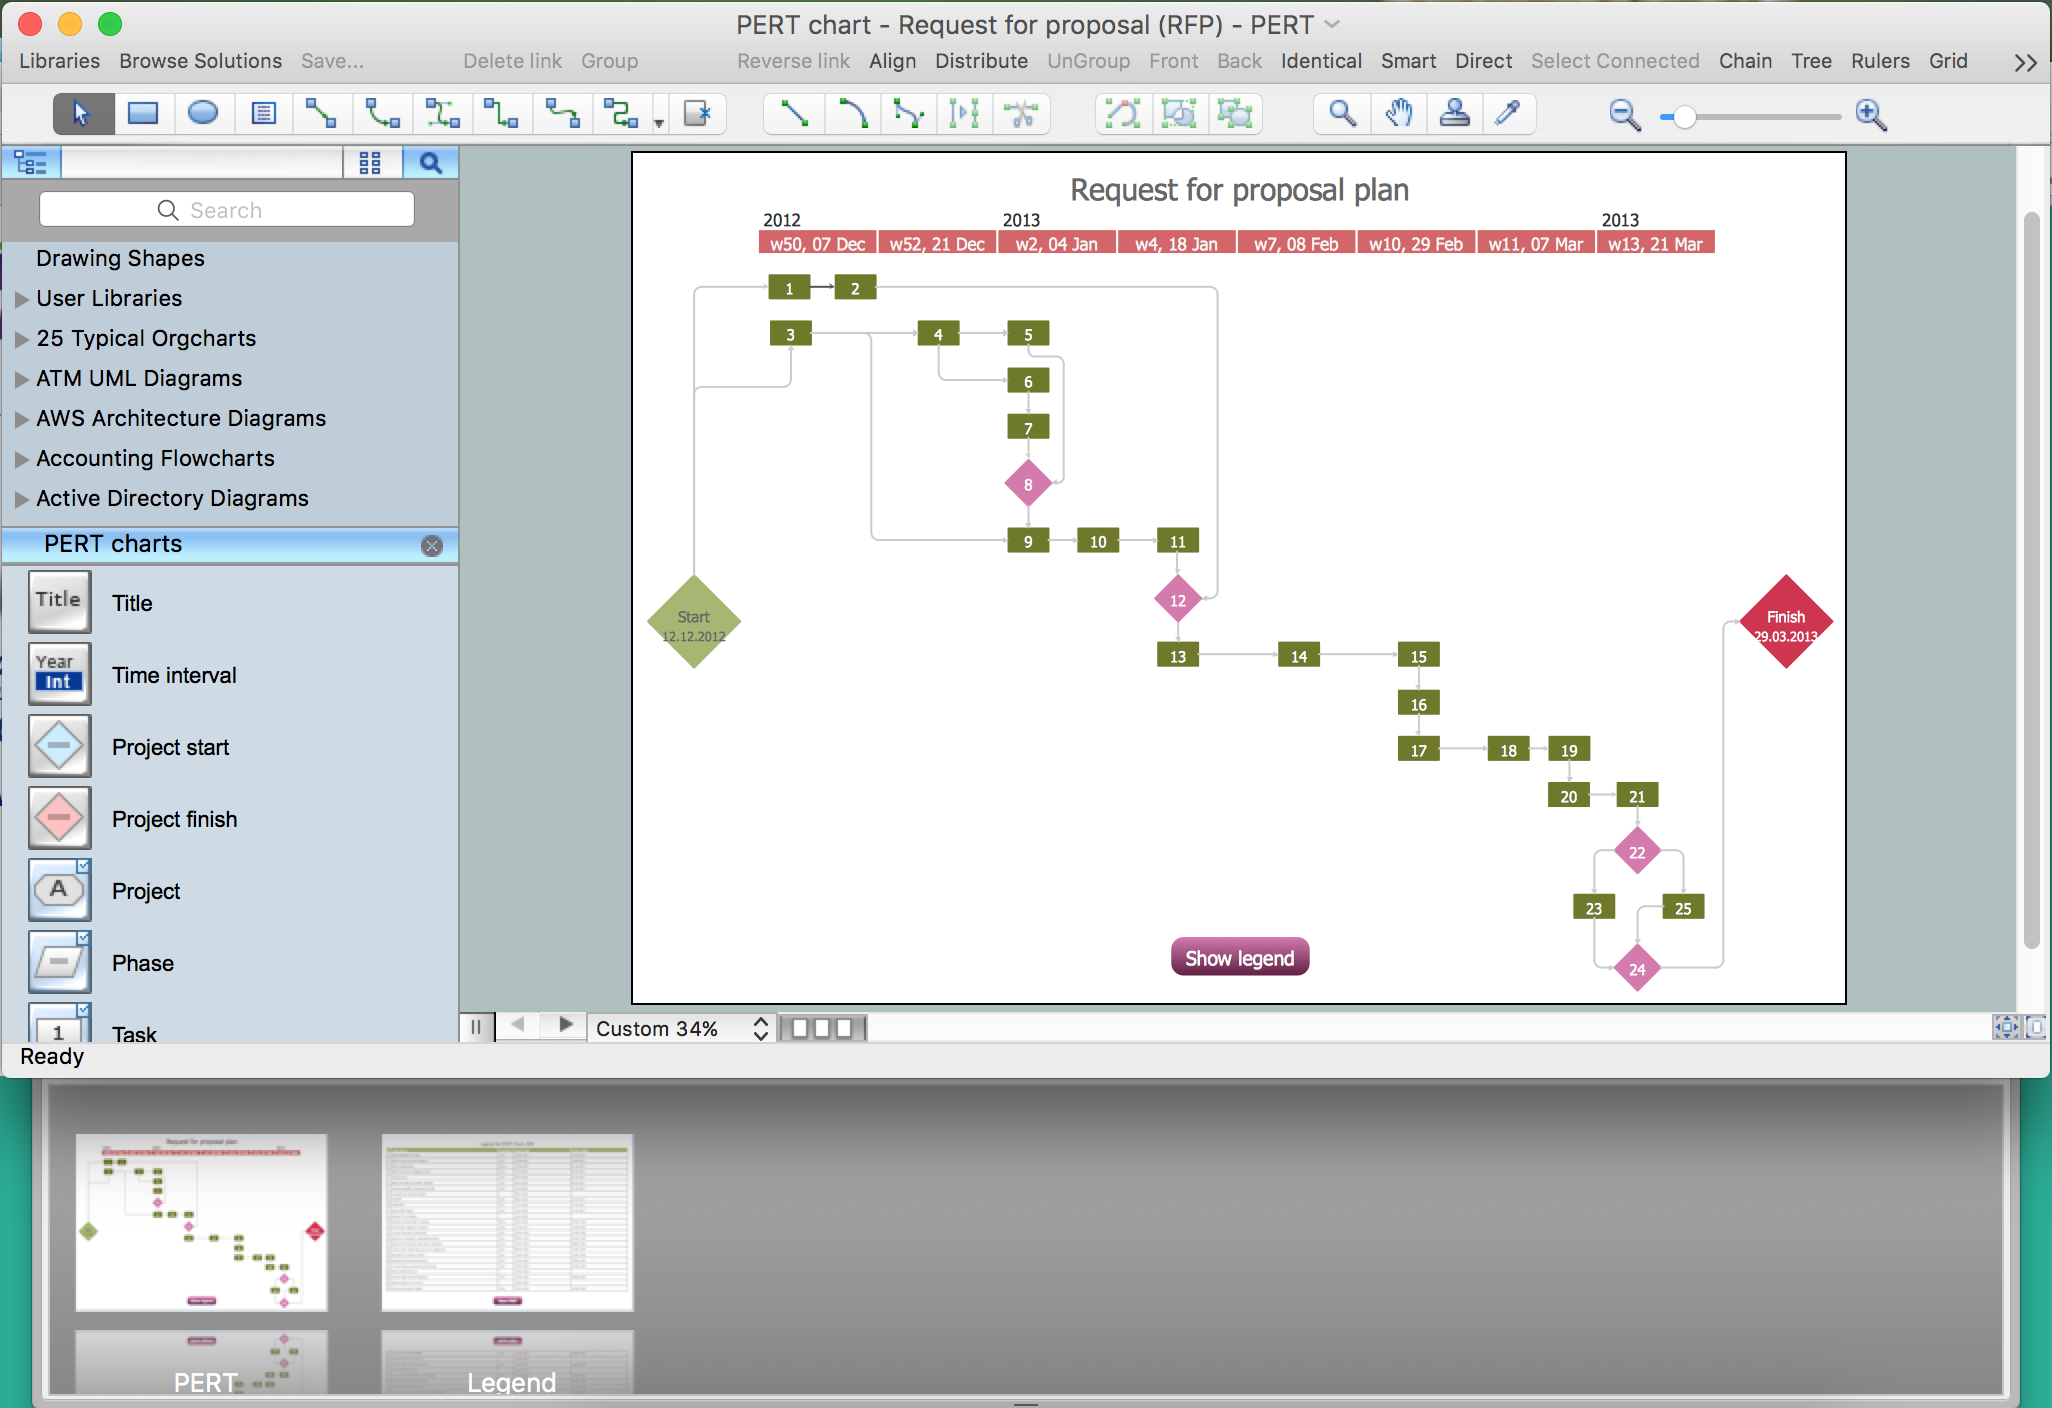
Picture: Program Evaluation and Review Technique (PERT) with ConceptDraw DIAGRAM
Related Solution:
ConceptDraw DIAGRAM extended with Typography Infographics Solution from the “Infographics” Area is the best Infographic Generator. Make sure in it right now!
Typography Infographics Solution offers you the best numerous collection of predesigned infographics examples and 9 libraries with large quantity of ready-to-use vector stencils that will help you design your own Typography Infographics of any complexity in minutes..Picture: Infographic Generator
Related Solution:
Lean Six Sigma (LSS) is a well-known in all over the world methodology of quality improvement and business perfection. ConceptDraw DIAGRAM diagramming and vector drawing software is a powerful Lean Six Sigma Diagram Software thanks to the included Value Stream Mapping solution from the Quality Management Area of ConceptDraw Solution Park.
Picture: Lean Six Sigma Diagram Software
Related Solution:
You need quickly design Playground Layouts? Use the tools of Sport Field Plans solution from the Building Plans area of ConceptDraw Solution Park to depict any of your ideas for the Playground Layouts.
Picture: Playground Layouts
Related Solution:
ConceptDraw is a best data visualization tool that will allow everyone to create rich infographics and visualizations quickly and easily.
Picture: Best Tool for Infographic Construction
Video tutorials on ConceptDraw products. Try it today!
Picture: How to Draw a Bubble Chart
Related Solution:
Electrical Engineering Solution used together with ConceptDraw DIAGRAM drawing facilities makes short a work of drawing various electrical and electronic circuit schemes. A library of vector objects composed from symbols of Analog and Digital Logic elements of electric circuit includes 40 symbolic images of logic gates, bistable switches of bi-stable electric current, circuit controllers, amplifiers, regulators, generators, etc. All of them can be applied in electronic circuit schemes for showing both analog and digital elements of the circuit.
Electrical Engineering Solution used together with ConceptDraw DIAGRAM drawing facilities makes short a work of drawing various electrical and electronic circuit schemes. A library of vector objects composed from symbols of Analog and Digital Logic elements of electric circuit includes 40 symbolic images of logic gates, bistable switches of bi-stable electric current, circuit controllers, amplifiers, regulators, generators, etc. All of them can be applied in electronic circuit schemes for showing both analog and digital elements of the circuit.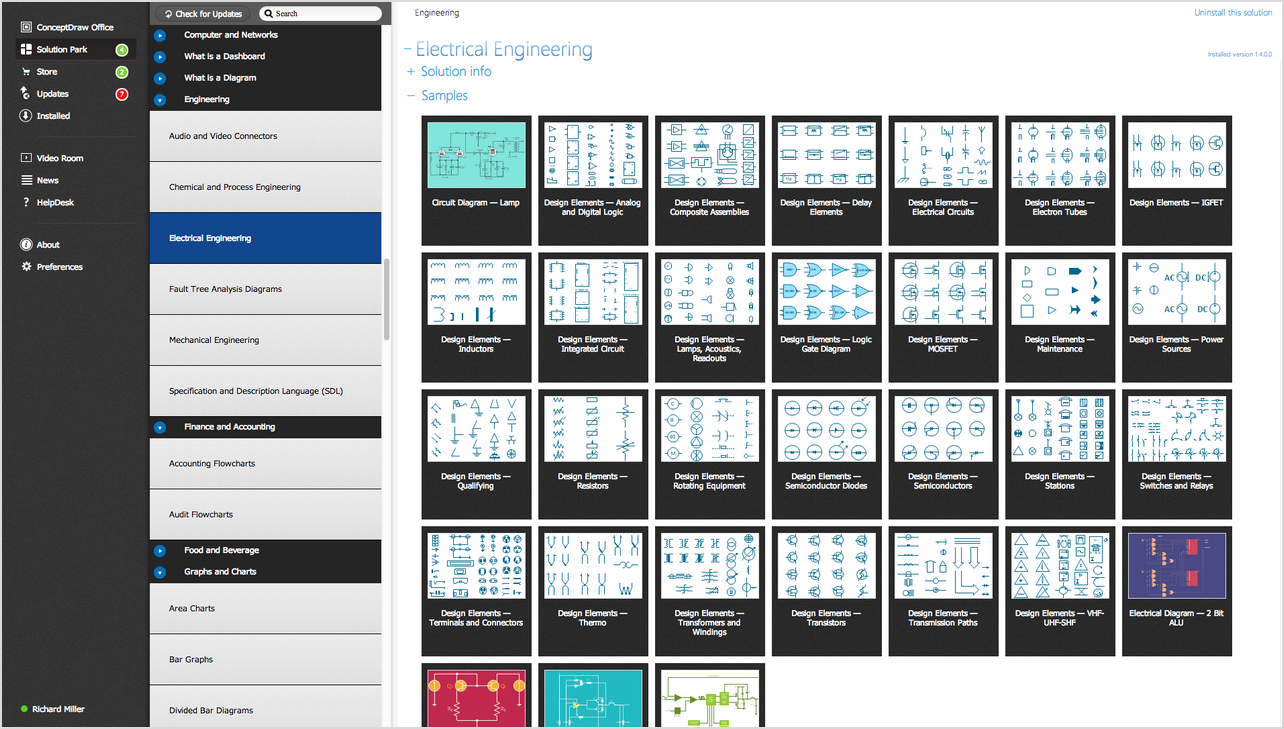
Picture:
Electrical Diagram Symbols F.A.Q.
How to Use Electrical ConceptDraw Diagram Software
Related Solution:
