Nature Drawings - How to Draw
|
ConceptDraw DIAGRAM is a nature drawings software. Nature solution expands this software possibilities to create beautiful illustrations diagrams with the new library which contains 17 vector objects. Users can use it including samples and templates by adding new library stencils to drawing for creating own illustration. |
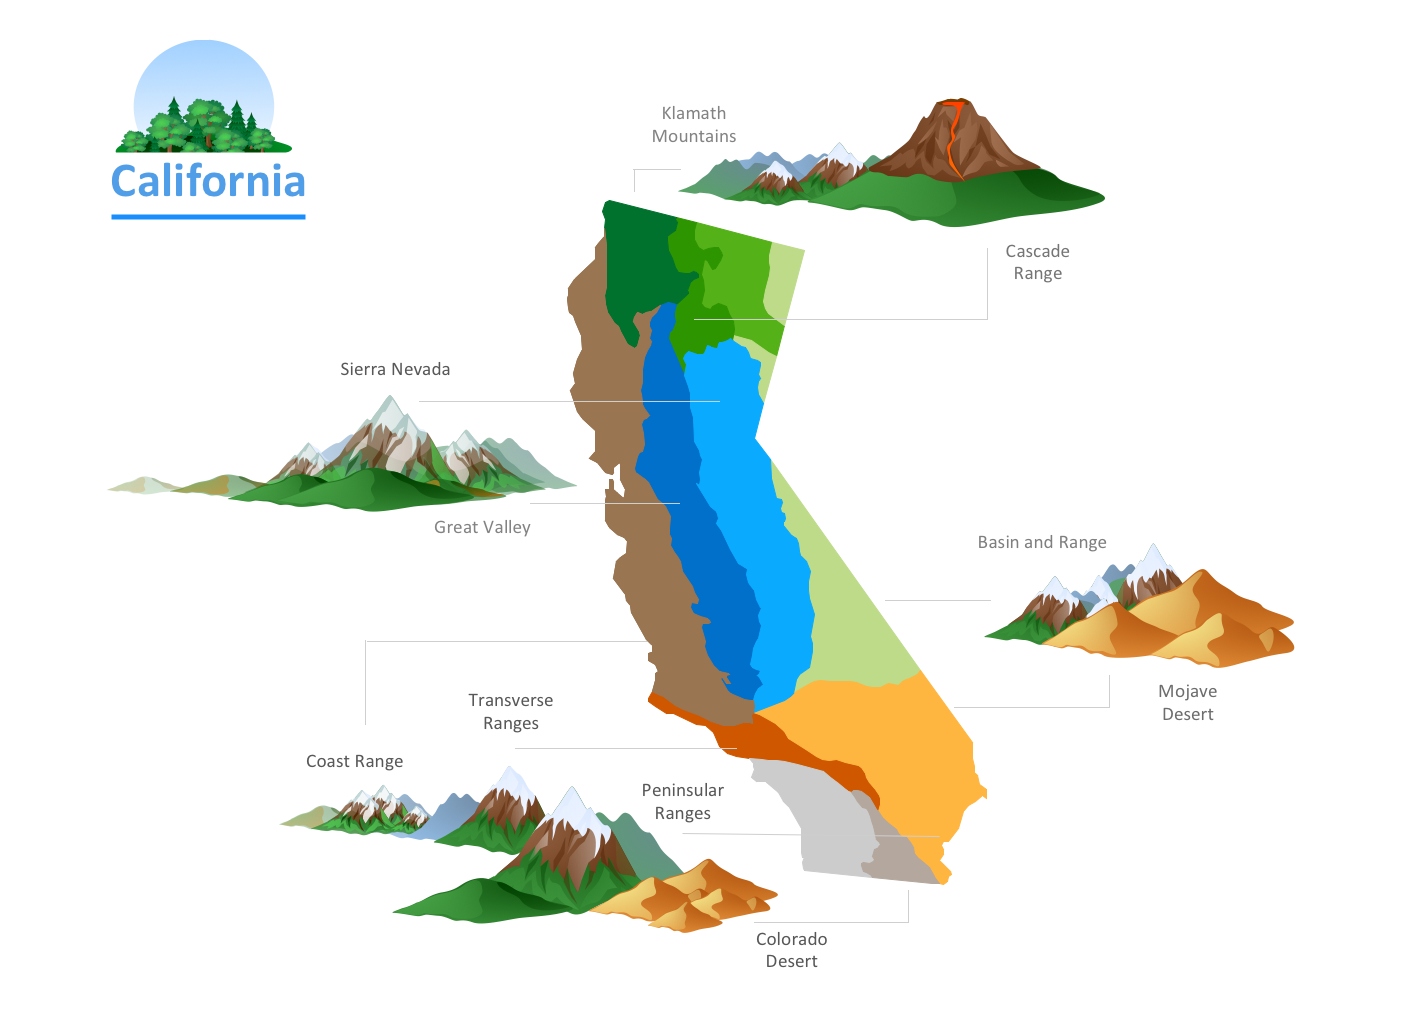
Pic.1 California relief - Infographics.
Using Geography library for ConceptDraw DIAGRAM software allows the user to produce professional-looking infographics in seconds. High resolution vector graphics is perfect for presentation needs. This image scales properly for large screens.
See also Samples:
TEN RELATED HOW TO's:
Tanzania, officially the United Republic of Tanzania (Swahili: Jamhuri ya Muungano wa Tanzania), is a country in East Africa in the African Great Lakes region.
The vector stencils library Tanzania contains contours for ConceptDraw DIAGRAM diagramming and vector drawing software. This library is contained in the Continent Maps solution from Maps area of ConceptDraw Solution Park.
Picture: Geo Map — Africa — Tanzania
Related Solution:
UML Use Case Diagrams are used to illustrate the structure of arbitrarily complex systems and illustrates the service consumer - service provider relationship between components.
Picture: UML Use Case Diagram. Design Elements
Using the Business Diagrams Solution you can create your own professional-looking Venn Diagrams quick and easy.
Picture: 3 Circle Venn Diagram. Venn Diagram Example
Related Solution:
ConceptDraw Business Finance Illustration examples and libraries contain vector clip art for drawing different Business and Finance Illustrations. You may find Advertising example, Project Management example, Business Model example and many more.
Picture: Business and Finance Illustrations Example
Related Solution:
In any unclear situation create a workflow diagram. Workflow diagrams help to understand processes, find bottlenecks and fix the process. When you create workflow diagram using ConceptDraw DIAGRAM software you are able to focus on thinking, not drawing, that makes you as effective as possible.
Picture: Create Workflow Diagram
Related Solution:
ConceptDraw DIAGRAM extended with Divided Bar Diagrams solution from Graphs and Charts area of ConceptDraw Solution Park is the best software for quick and simple drawing the Divided Bar Diagrams and Bar Diagram Math.
Picture: Bar Diagram Math
Related Solution:
What is a Concept Map and what software is effective for its design? A concept map or conceptual diagram is a diagram that depicts suggested relationships between concepts. As for effective software - we suggest you to pay attention for the ConceptDraw DIAGRAM diagramming and vector drawing software. Extended with Concept Maps Solution from the Diagrams Area it is a real godsend for you.
Picture: What Is a Concept Map
Related Solution:
The Accounting flowchart shows how information flows from source documents through the accounting records. The are based on the accounting procedures or processes.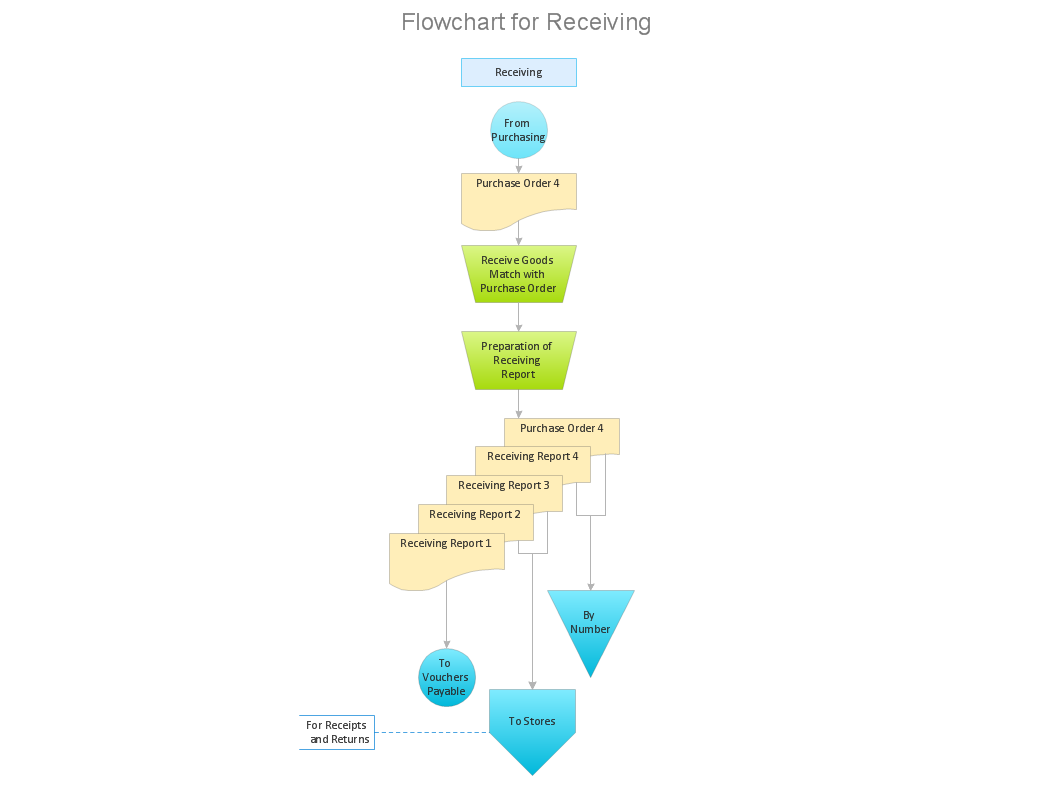
Picture: What process should be essentially adopted.Accounting Flowchart Example
Related Solution:
ConceptDraw - Perfect Network Diagramming Software with examples of Backbone Network Diagrams. ConceptDraw Network Diagram is ideal for network engineers and network designers who need to draw Backbone Network diagrams.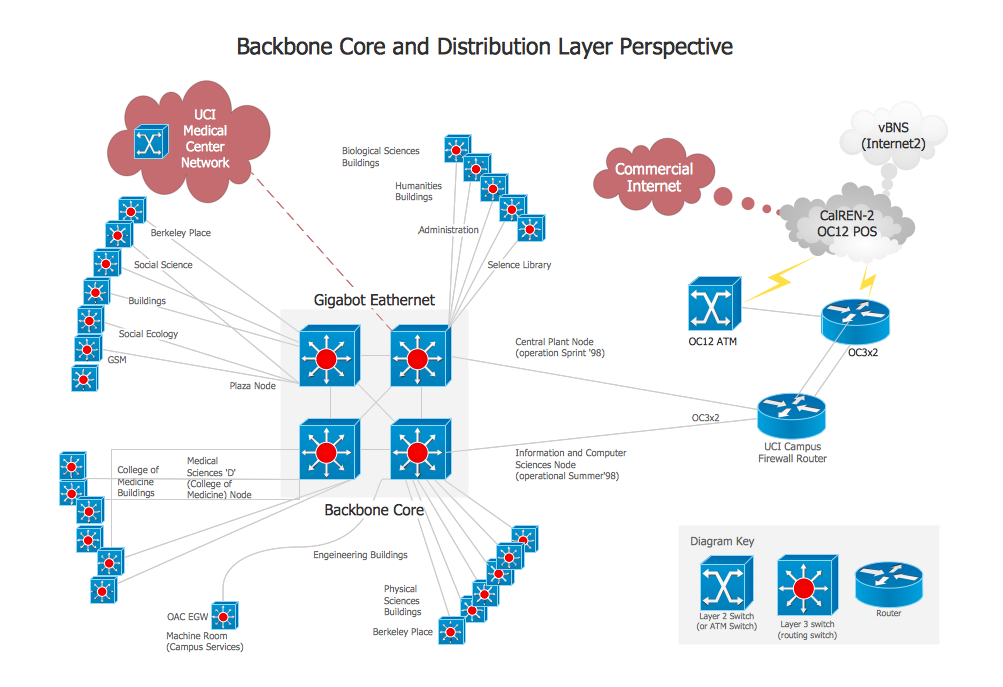
Picture: Network Diagram SoftwareBackbone Network
Do you like the professional schemes that you can find on the Internet? Take into account that the most part of them is made using the Best Flowchart Software and Flowchart Symbols. Try you own powers in creating such diagrams!
Flowcharts are the most business diagramming tool. If you are a business manager, you can use flow chart to depict work flow in your organization, develop the effective organizational structure and present the information to investors or other stakeholders. Combining the smart management solutions with ConceptDraw DIAGRAM diagramming engine delivers the set of comprehensive flowchart tools necessary to support professionals in their creativeness and business activity.
Picture: Best Flowchart Software and Flowchart Symbols
Related Solution:
ConceptDraw
DIAGRAM 18