Reporting Dashboard Software for Business
Sales Dashboard Solution
The Sales Dashboard Solution gives users the ability to use live data to drive displays that show sales performance in a wide variety of graphs. ConceptDraw DIAGRAM is a software for making Live charts anв gauges that provide effectiveness to your business. Dashboards allow you to capture and report specific data points from each department within the organization, thus providing a "snapshot" of performance. By using dashboards one obtain benefits:
- Measure efficiencies/inefficiencies
- Ability to generate detailed reports
- Saves time compared to running multiple reports
- Gain total visibility of all systems instantly
Pic. 1. Sales Dashboard Design Elements (Apple macOS)
THREE RELATED HOW TO's:
ConceptDraw Sales Dashboard is an automatically updated sales dashboard you can customize to see KPI you need. You can access sales dashboard anywhere to get fresh data and use any minute to see how your business can improve.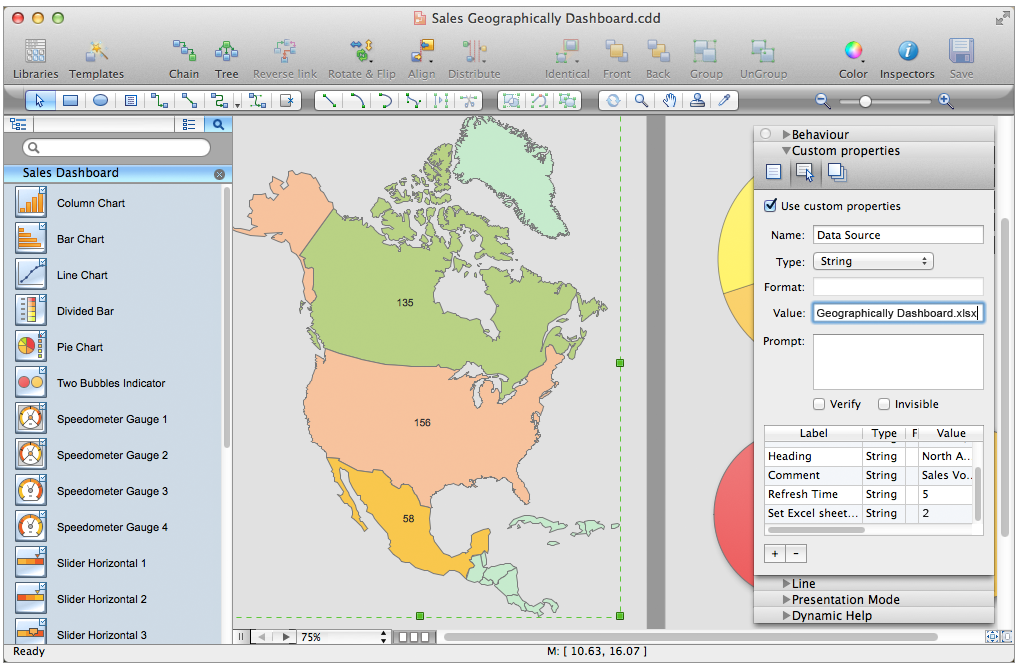
Picture: Sales Dashboard - Access Anywhere
ConceptDraw PRo is a software that is perfect for creating dynamic dashboards for visualizing sales data. You can match your KPI to pre-designed visual indicators and start tracking your sales performance in real-time.
Picture: Dashboard Software
Project Management Trends. Status report presentation tool for remote teams, using Skype to collaborate on project objectives.
Picture: How To Hold Project Collaboration via Skype
Related Solution:
ConceptDraw
DIAGRAM 18