Sales Dashboard - Access Anywhere
Sales Dashboard Solution
ConceptDraw DIAGRAM is a software for making BI dashboards that provide effectiveness to your enterprise. The Sales Dashboard Solution allows managers to use live data to drive dashboards that show company performance in a wide variety of graphs. The clean and dynamic dashboard objects are driven by data files, and are updated automatically as the data changes. Dashboards allow you to capture and report specific data points from each department within the organization, thus providing a "snapshot" of performance.
Pic. 1. Sales Dashboard - Design Elements for mac
NINE RELATED HOW TO's:
When thinking about data visualization, one of the first tools that comes to mind is a flowchart design. You can find flowchart symbols, shapes, stencils and icons easily on the Internet, but it might take time to systematize this information. Nevertheless, once you start flowcharting, you’ll love its simplicity and efficiency.
This diagram consists from standard flowchart symbols, approved by ANSI (American National Standard Institute) for drawing flowcharts. A flowchart is a diagram that represents a step-by-step algorithm of any process, displaying the process stages as boxes that are connected with arrows. Flowchart design makes it clear and readable.
Flowchart designed using ConceptDraw DIAGRAM flowchart software allows to make attractive and clear process presentation, it makes interpretation of the business process flow fresh and versatile. Great flowchart design view is a big advantage over the diagram created manually on a paper.
Picture:
Flowchart Design
Flowchart Symbols, Shapes, Stencils and Icons
Related Solution:
This sample was created in ConceptDraw DIAGRAM diagramming and vector drawing software using the UML State Mashine Diagram library of the Rapid UML Solution from the Software Development area of ConceptDraw Solution Park.
This sample shows the work of the online store and can be used for the understanding of the online shopping processes, for projection and creating of the online store.
Picture: State Diagram Example — Online Store
Related Solution:
The ConceptDraw vector stencils library Cisco Multimedia, Voice, Phone contains equipment symbols for drawing the computer network diagrams.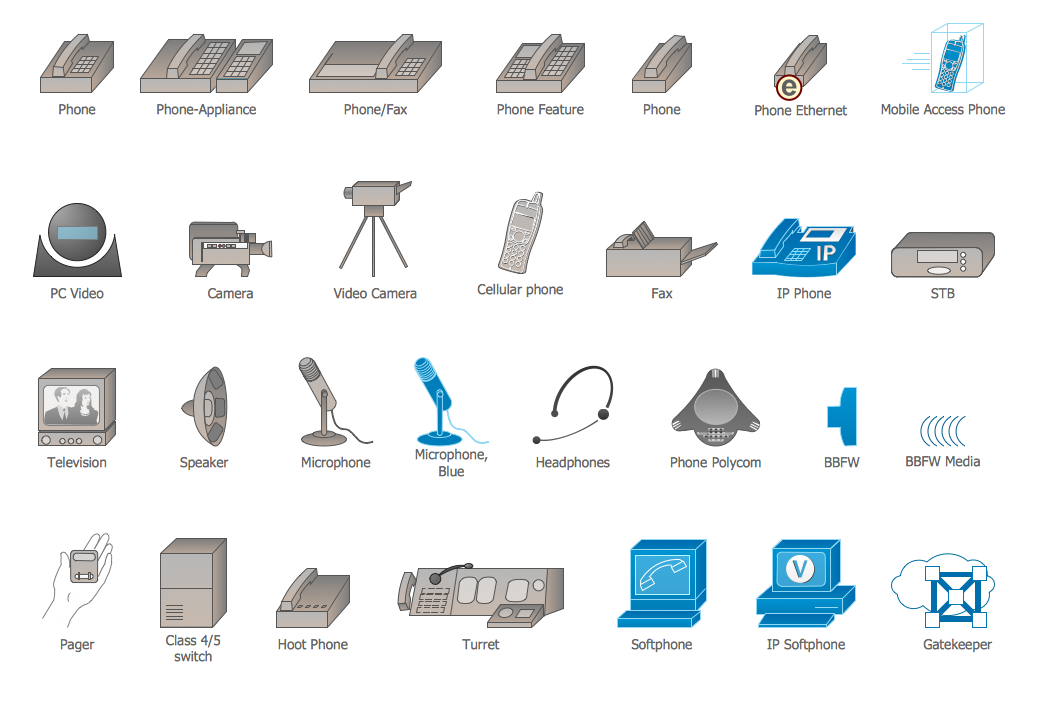
Picture: Cisco Multimedia, Voice, Phone. Cisco icons, shapes, stencils and symbols
Related Solution:
You need create a Sales Process Map? Use the ConceptDraw DIAGRAM software which is ideal for the sales process management, marketing and engineering thanks to the powerful Sales Flowcharts solution from the Marketing area of ConceptDraw Solution Park.
Picture: Sales Process Map
Related Solution:
ConceptDraw Sales Dashboard is an automatically updated sales dashboard you can customize to see KPI you need. You can access sales dashboard anywhere to get fresh data and use any minute to see how your business can improve.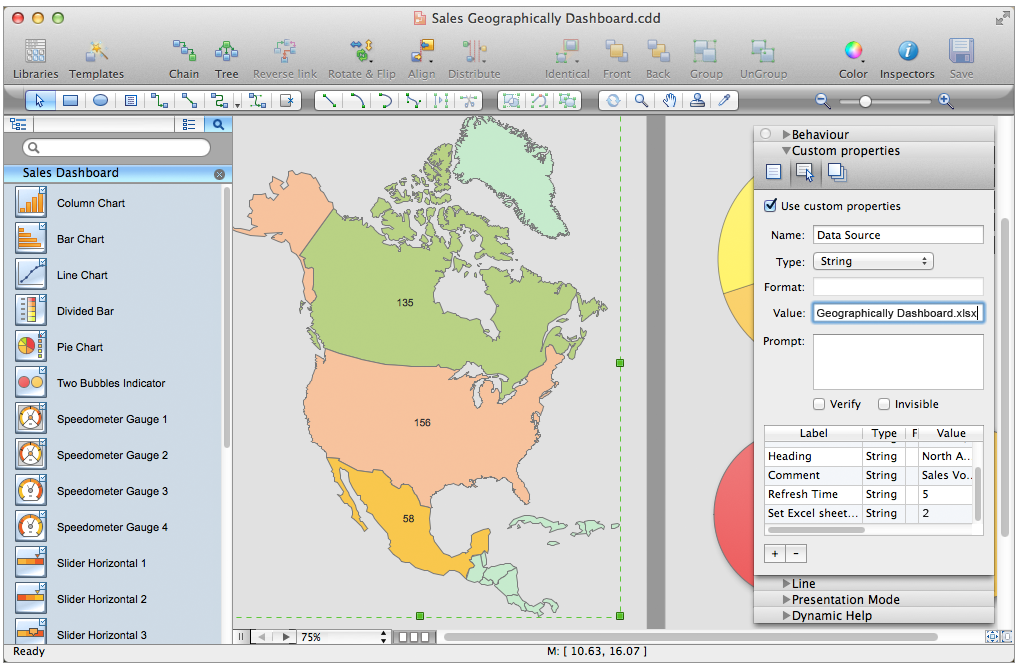
Picture: Sales Dashboard - Access Anywhere
Scrum →
What is Scrum? Scrum is the famous agile software development methodology which depicts an iterative and incremental approach for the work on the complex projects. Use ConceptDraw DIAGRAM diagramming and vector drawing software extended with SCRUM Workflow solution to draw various types of professional-looking Scrum Charts, Scrum Workflow Diagrams, Scrum Mind Maps, Scrum boards and attractive Scrum Infographics.
Picture: Scrum
Related Solution:
Stakeholder management is a critical component to the successful delivery of any project, programme or activity.
ConceptDraw DIAGRAM is a powerful diagramming and vector drawing software. Now, thanks to the Stakeholder Onion Diagrams Solution included to the Management Area of ConceptDraw Solution Park, ConceptDraw DIAGRAM became also unique stakeholder management system design software.
Picture: Stakeholder Management System using Onion Diagram
Related Solution:
Boost your brand awareness and recognition through graphic design.
ConceptDraw DIAGRAM business graphics software provides wide opportunities for creativity and helps generate amazing visuals.
Picture: Business Graphics Software
It doesn’t matter what kind of business you have, a bar or a gym, there are common concepts for any of them. One of those concepts is accounting, and to facilitate the work with the figures, you can use accounting flowchart symbols and create a clear and representative scheme. You can create flowchart for auditing, tax accounting and even for planning your own budget.
A graphical tool for displaying successive processes is flowchart. This method is mostly suited to represent an accounting process. The sequence of steps in the accounting process usually consists of standard accounting procedures, that can be depicted by using a minimal number of symbols, applied for the basic flowcharting. The advanced opportunity to create professional Accounting Flow charts is provided by ConceptDraw Accounting Flowcharts solution. It includes contains a library of accounting flowchart symbols used when drawing the accounting process flow.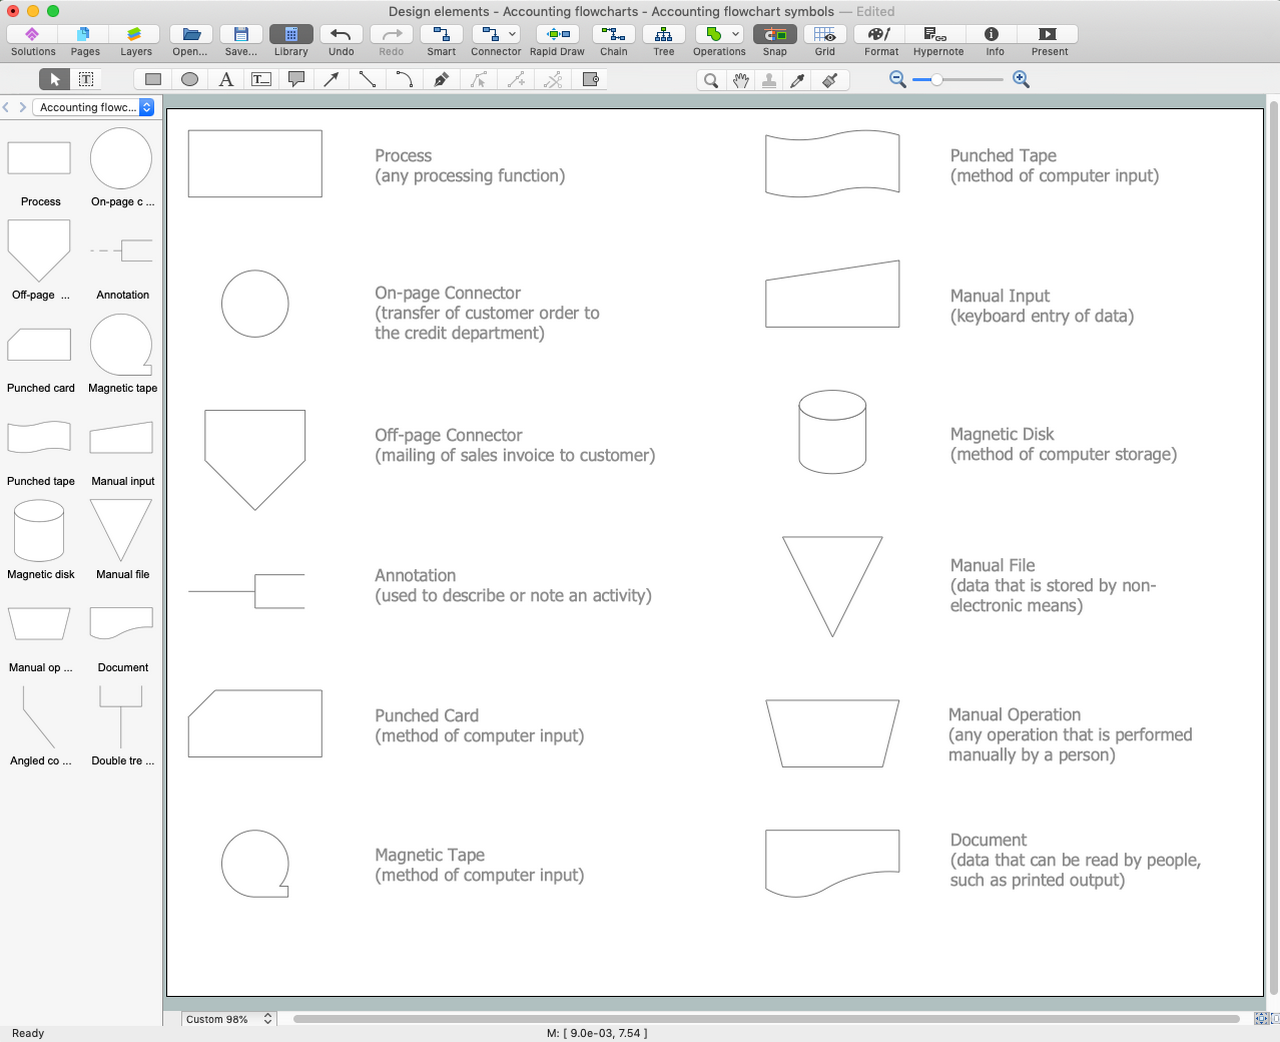
Picture: Accounting Flowchart Symbols
Related Solution:
ConceptDraw
DIAGRAM 18