Risk Analysis
Management and Planning tools
ConceptDraw OFFICE suite is a software for decision making. The Seven Management and Planning Tools is a tool for Risks Diagram drawing. This diagram identifies possible risks in accomplishing corrective actions. With the Risks Diagram, one analyzes each action separately in a tree of all actions and develops a preventive action in response of each potential obstacles or circumstances which may be a risk.
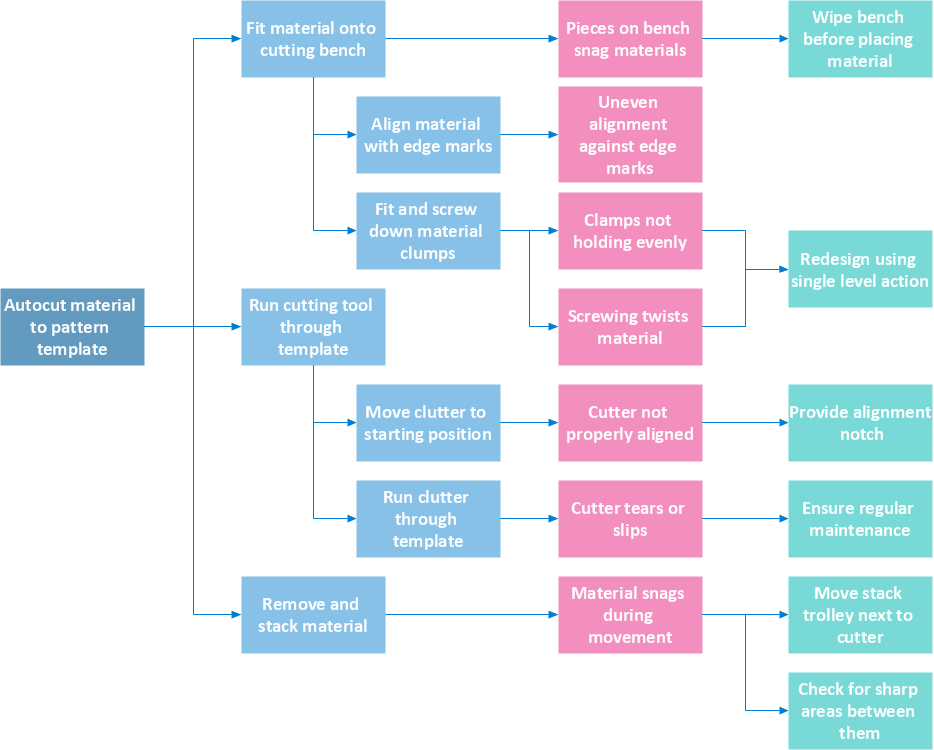
Pic.1 Risk Analysis. Process decision program chart (PDPC) - Minimization of material wastage.
The Risk diagram (Process Decision Program Chart) determines the risks when corrective action is not performed correctly. Also, it helps develop descriptions for preventive actions at the level of execution.
See also:
NINE RELATED HOW TO's:
If you want to find a way to understand complex things in minutes, you should try to visualize data. One of the most useful tool for this is creating a flowchart, which is a diagram representing stages of some process in sequential order. There are so many possible uses of flowcharts and you can find tons of flow charts examples and predesigned templates on the Internet. Warehouse flowchart is often used for describing workflow and business process mapping. Using your imagination, you can simplify your job or daily routine with flowcharts.
Warehouse flowcharts are used to document product and information flow between sources of supply and consumers. The flowchart provides the staged guidance on how to manage each aspect of warehousing and describes such aspects as receiving of supplies; control of quality; shipment and storage and corresponding document flow. Warehouse flowchart, being actual is a good source of information. It indicates the stepwise way to complete the warehouse and inventory management process flow. Also it can be very useful for an inventory and audit procedures.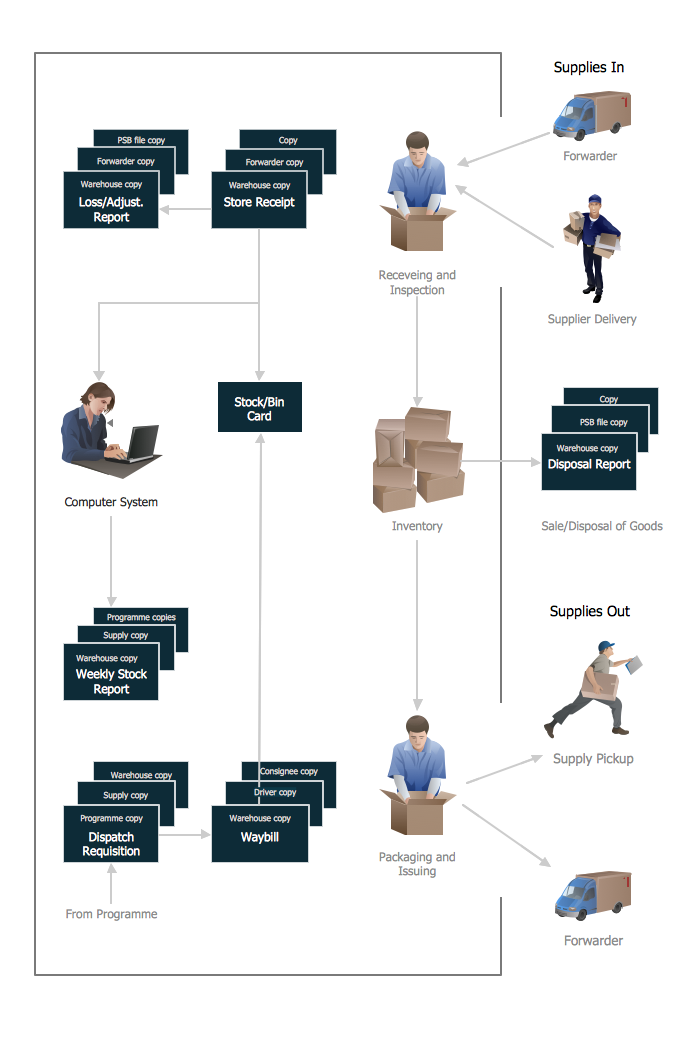
Picture: Flow Chart Example: Warehouse Flowchart
Related Solution:
Relationships Analysis. Relations Diagram - factors analysis, factors relations. Create Relations Diagram with ConceptDraw DIAGRAM.
The Seven Management and Planning Tools is a tool for Interaction diagram drawing. This diagram identifies causal relationships. Determine what factors are causes and which factors are effects. Interaction diagram helps establish KPIs to monitor changes and the effectiveness of corrective actions in resolving the problem.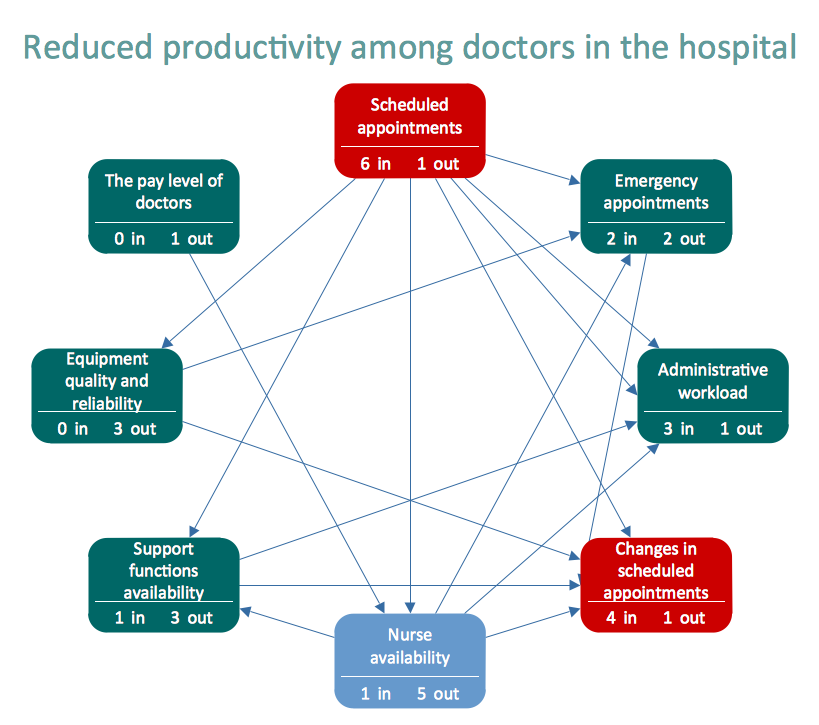
Picture: Relationships Analysis
The recruitment process often requires design and use of various HR flowcharts, diagrams, attractive illustrations.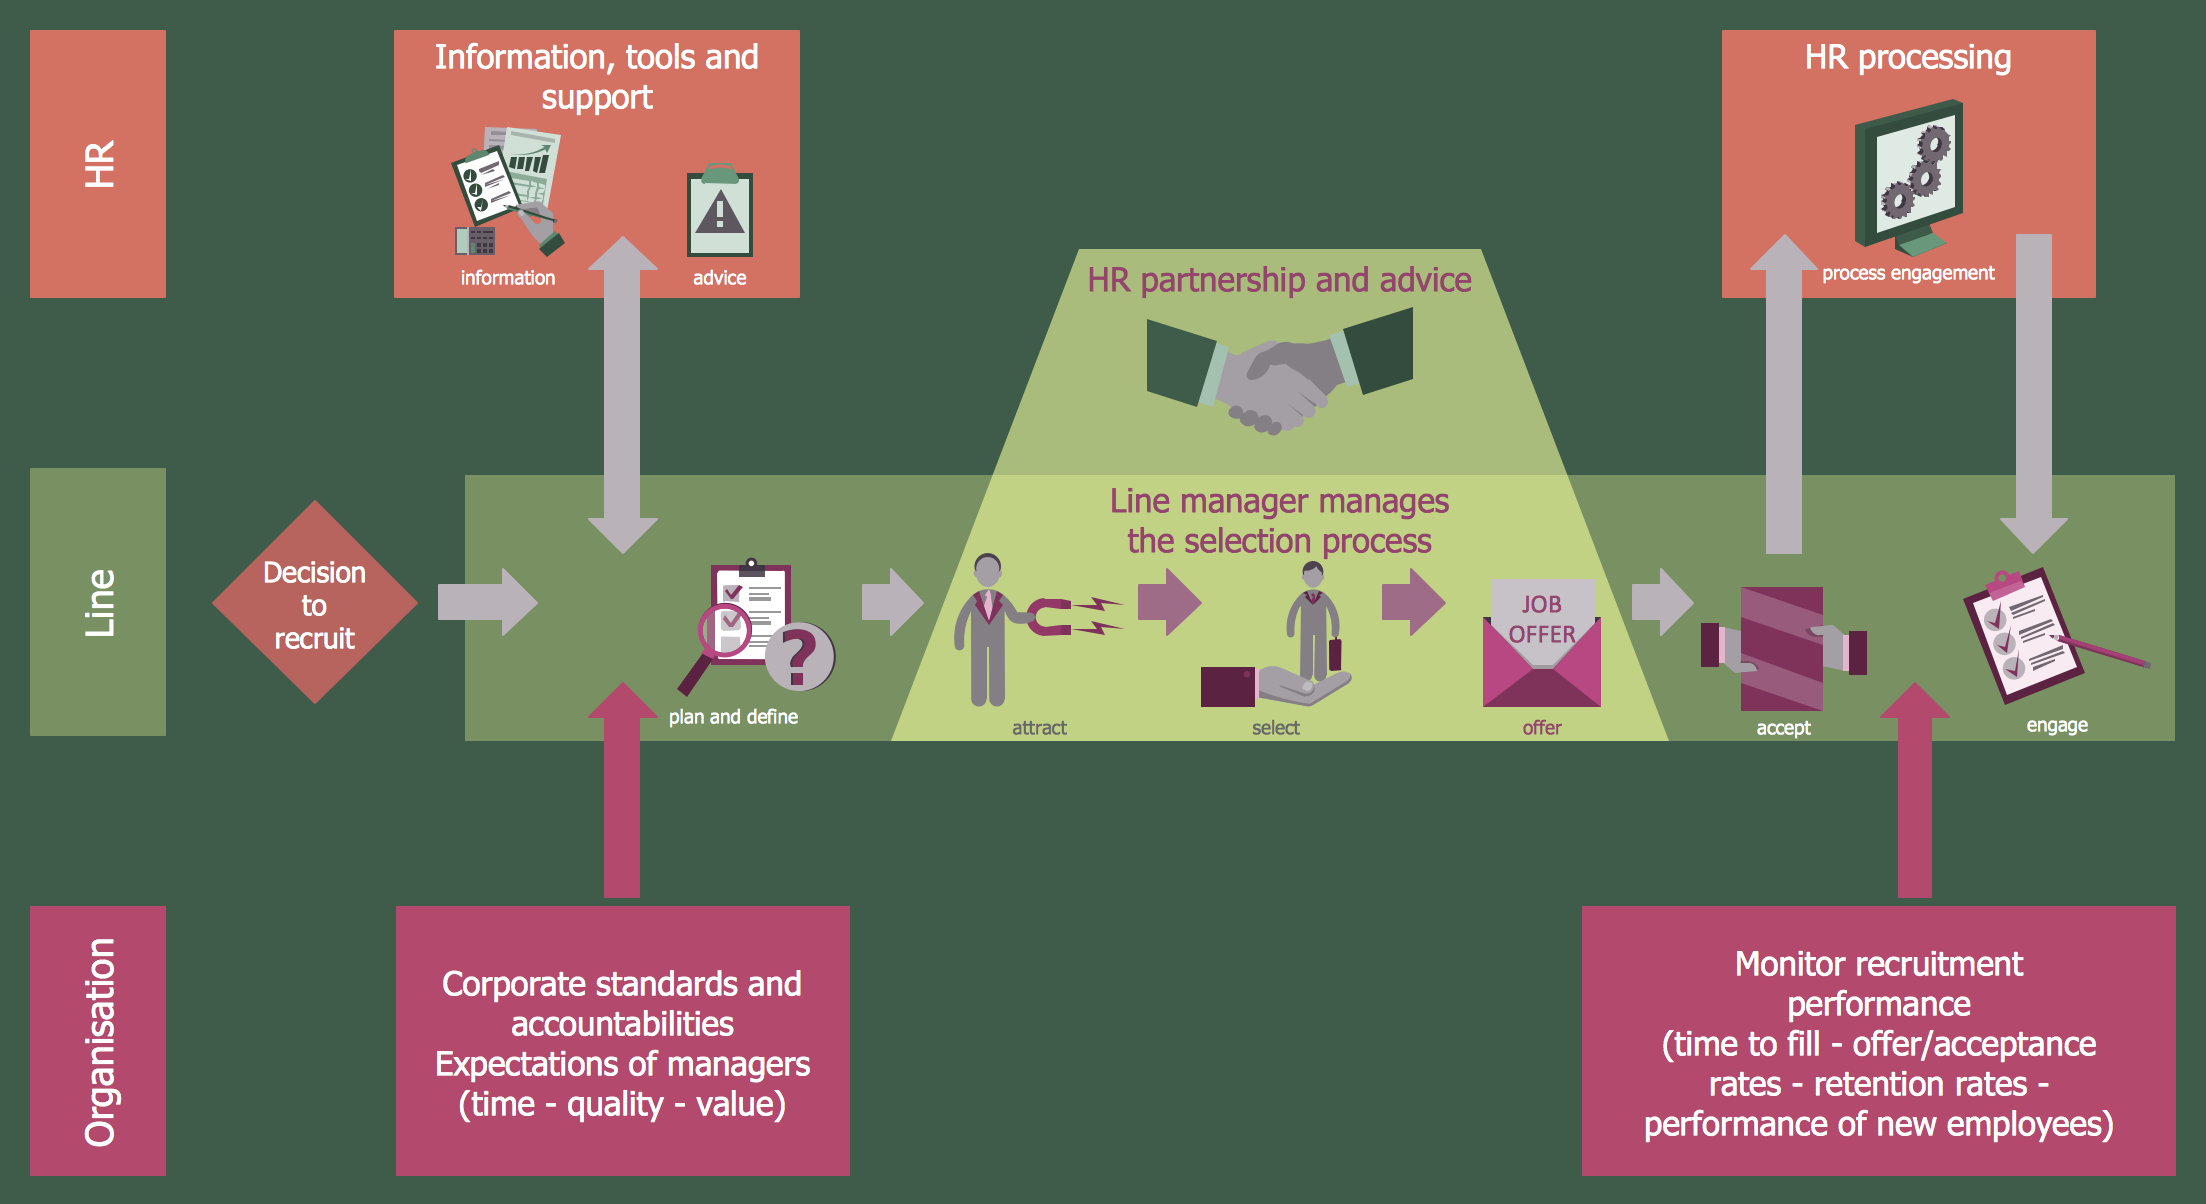
Picture: Recruitment
Related Solution:
The vector stencils library IDEF0 Diagram from the solution IDEF0 Diagrams contains specific IDEF0 diagram symbols such as arrow symbols and entity symbols for ConceptDraw DIAGRAM software.
Picture: IDEF0 Diagram
Related Solution:
While creating flowcharts and process flow diagrams, you should use special objects to define different statements, so anyone aware of flowcharts can get your scheme right. There is a short and an extended list of basic flowchart symbols and their meaning. Basic flowchart symbols include terminator objects, rectangles for describing steps of a process, diamonds representing appearing conditions and questions and parallelograms to show incoming data.
This diagram gives a general review of the standard symbols that are used when creating flowcharts and process flow diagrams. The practice of using a set of standard flowchart symbols was admitted in order to make flowcharts and other process flow diagrams created by any person properly understandable by other people. The flowchart symbols depict different kinds of actions and phases in a process. The sequence of the actions, and the relationships between them are shown by special lines and arrows. There are a large number of flowchart symbols. Which of them can be used in the particular diagram depends on its type. For instance, some symbols used in data flow diagrams usually are not used in the process flowcharts. Business process system use exactly these flowchart symbols.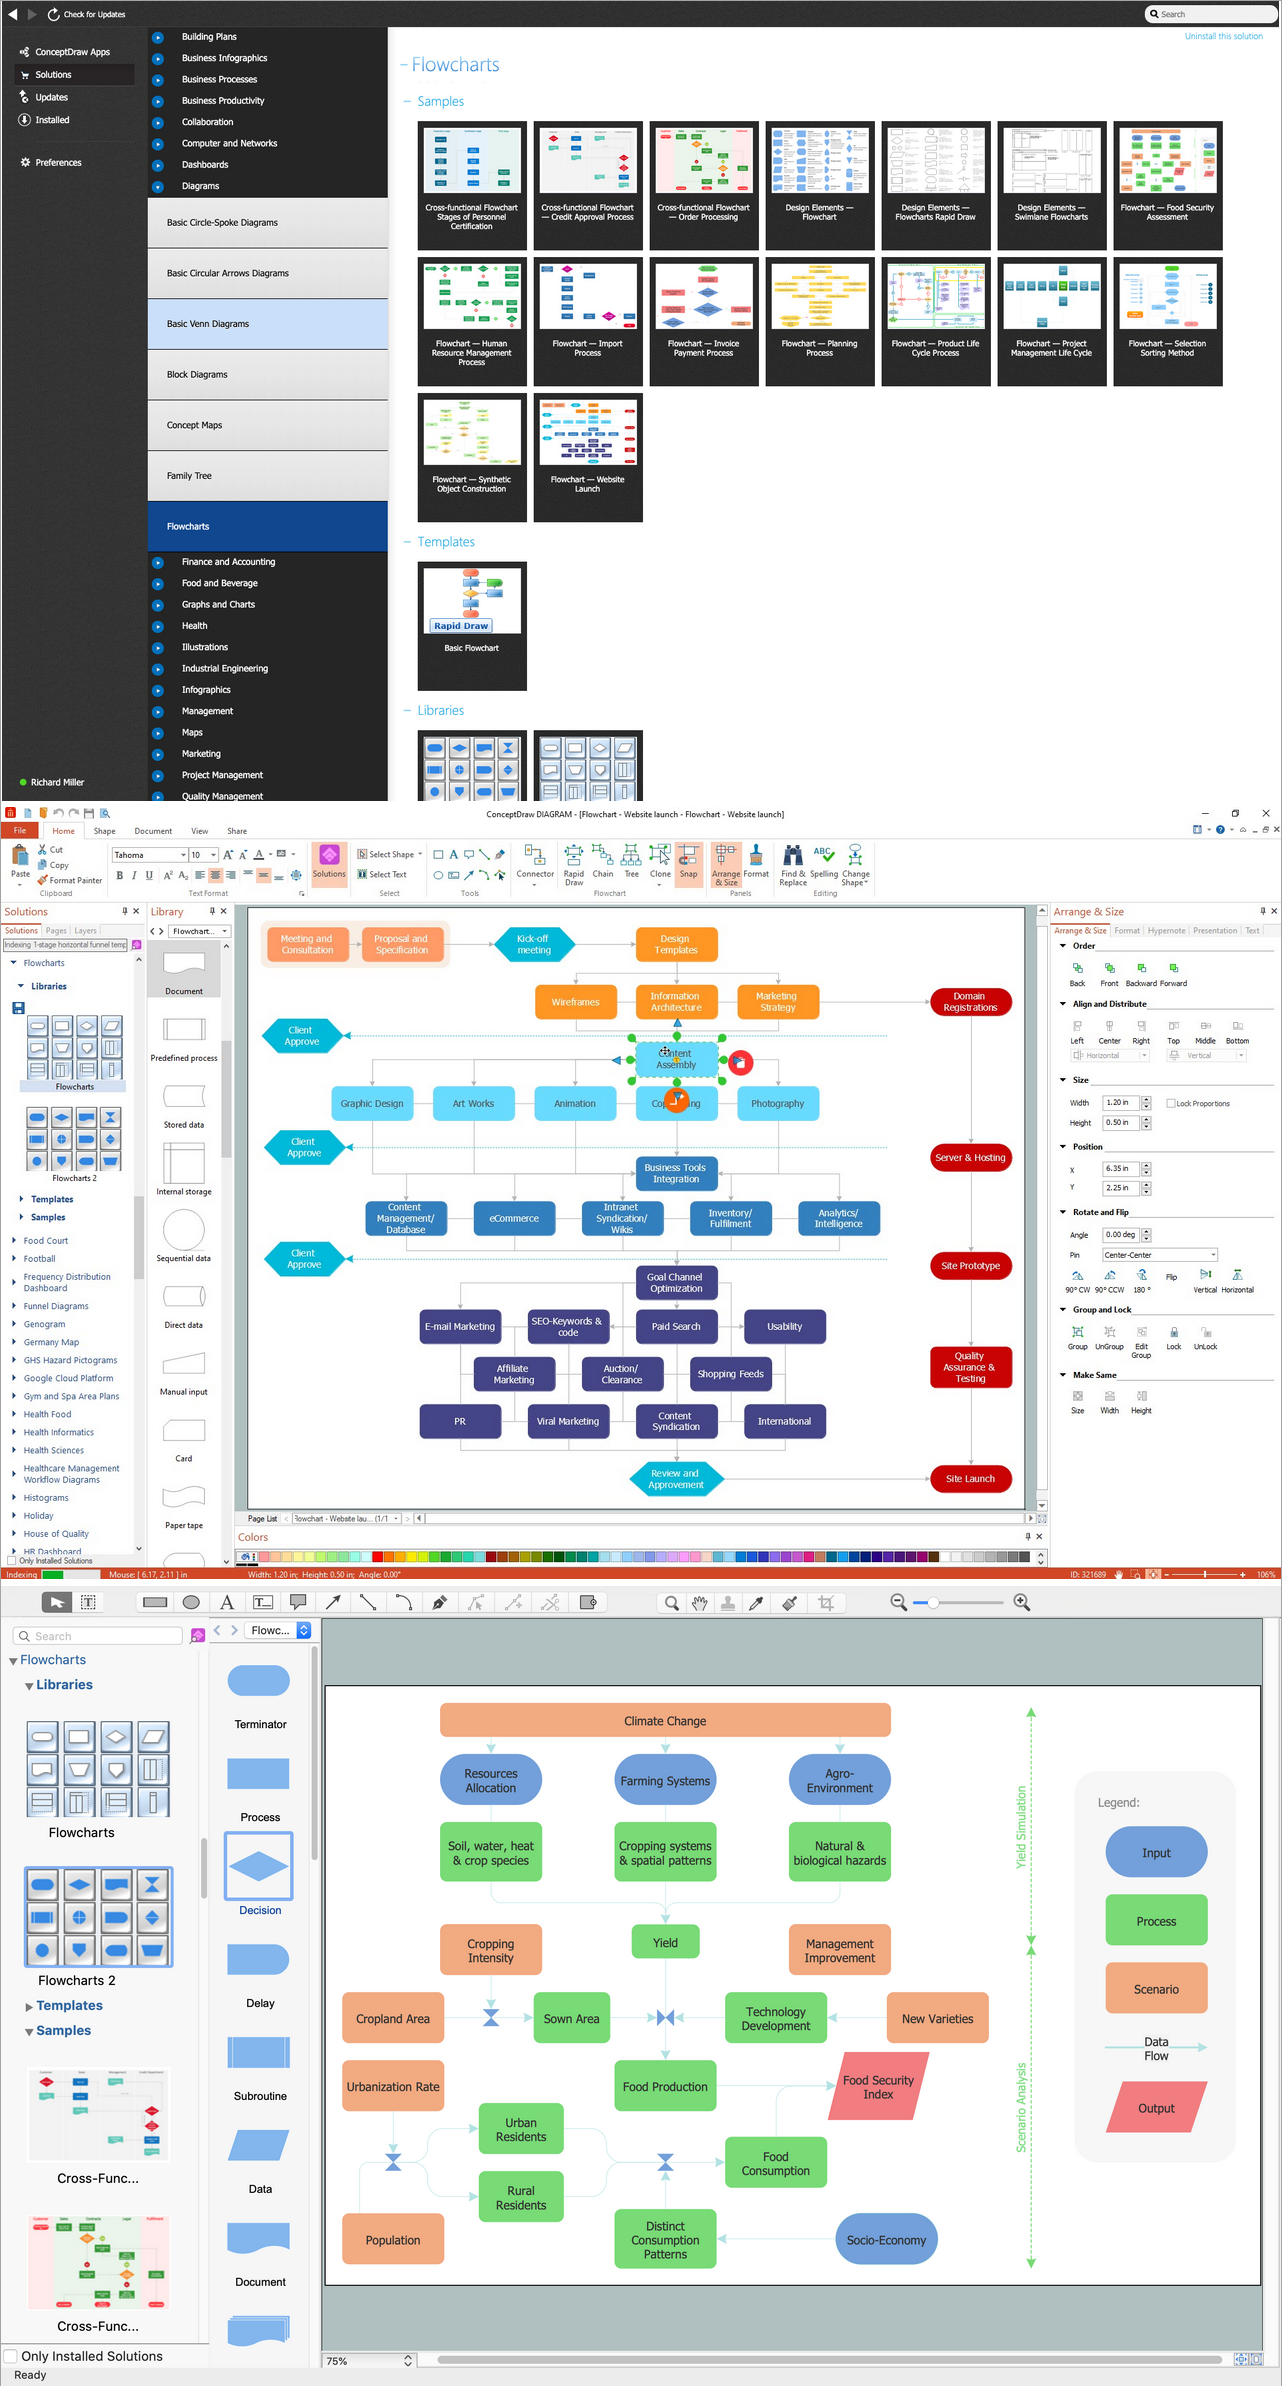
Picture: Basic of Flowchart: Meaning and Symbols
Related Solution:
You can design the Prioritization Matrix by hand on the paper, but we offer you the most easier way — to use the ConceptDraw DIAGRAM diagramming and vector drawing software extended with Seven Management and Planning Tools Solution from the Management Area.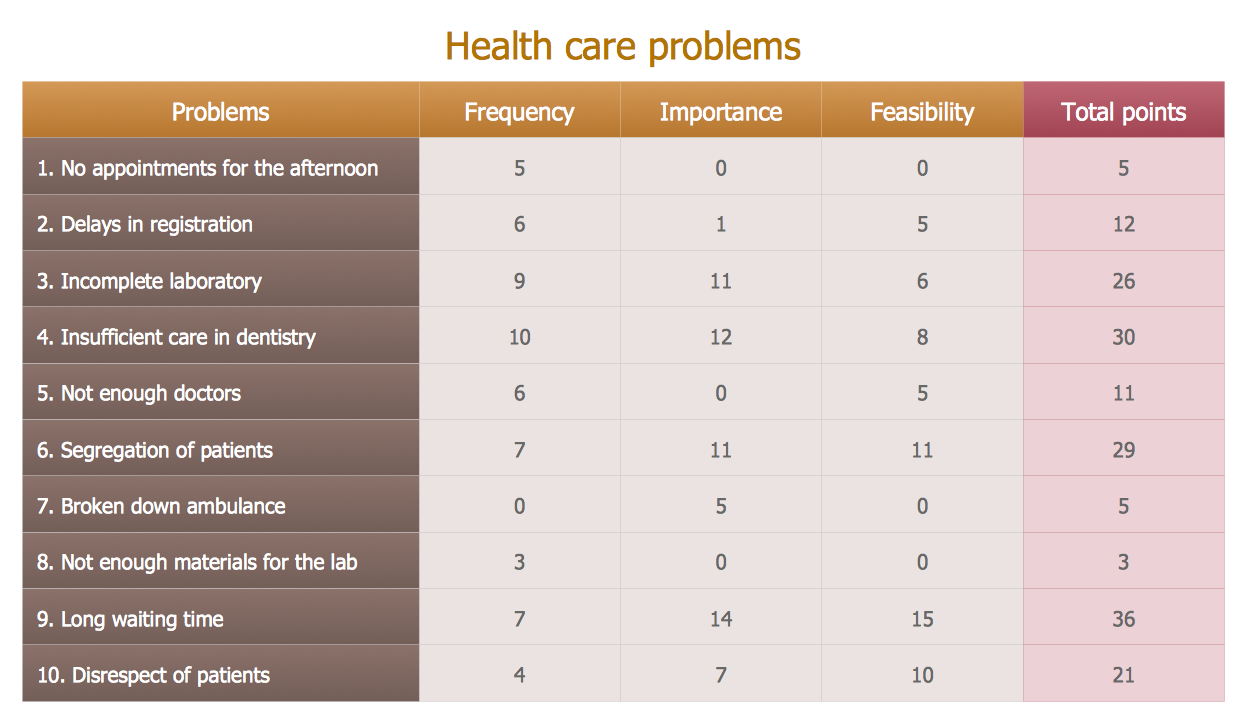
Picture: Prioritization Matrix
Related Solution:
Create flowcharts, org charts, floor plans, business diagrams and more with ConceptDraw DIAGRAM.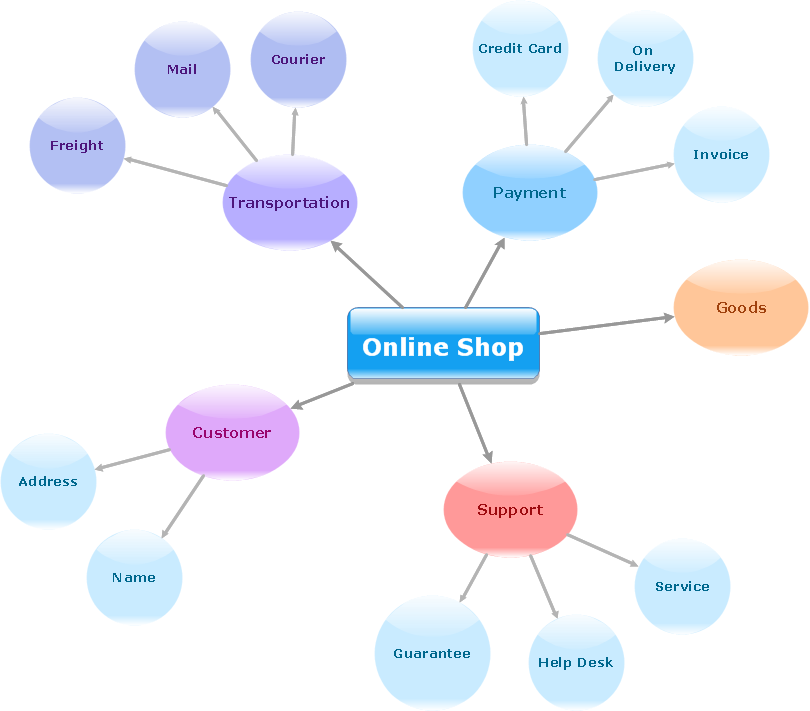
Picture: Simple Diagramming
Related Solution:
Accounting flowchart is a pictorial way to represent the flow of data in an organization and the flow of transactions process in a specific area of its accounting or financial department. Accounting Flowcharts solution contains the full set of standardized accounting flowchart symbols which will help you design in minutes various types of Accounting Flowcharts including such popular diagrams which represent the whole accounting process: Purchasing Flowchart, Receiving Flowchart, Voucher Payable Flowchart, Treasurer Flowchart, Payment Flowchart.
Picture: Accounting Flowchart Purchasing Receiving Payable and Payment
Related Solution:
Decision Making - ConceptDraw OFFICE suite provides visual tools that are given support on the stage of the decision making.
The Seven Management and Planning Tools is a set for such diagrams: Affinity Diagram, Relations Diagram, Prioritization Matrix, Root Cause Tree Diagram, Involvement Matrix, PERT Chart, Risk Diagram (PDPC).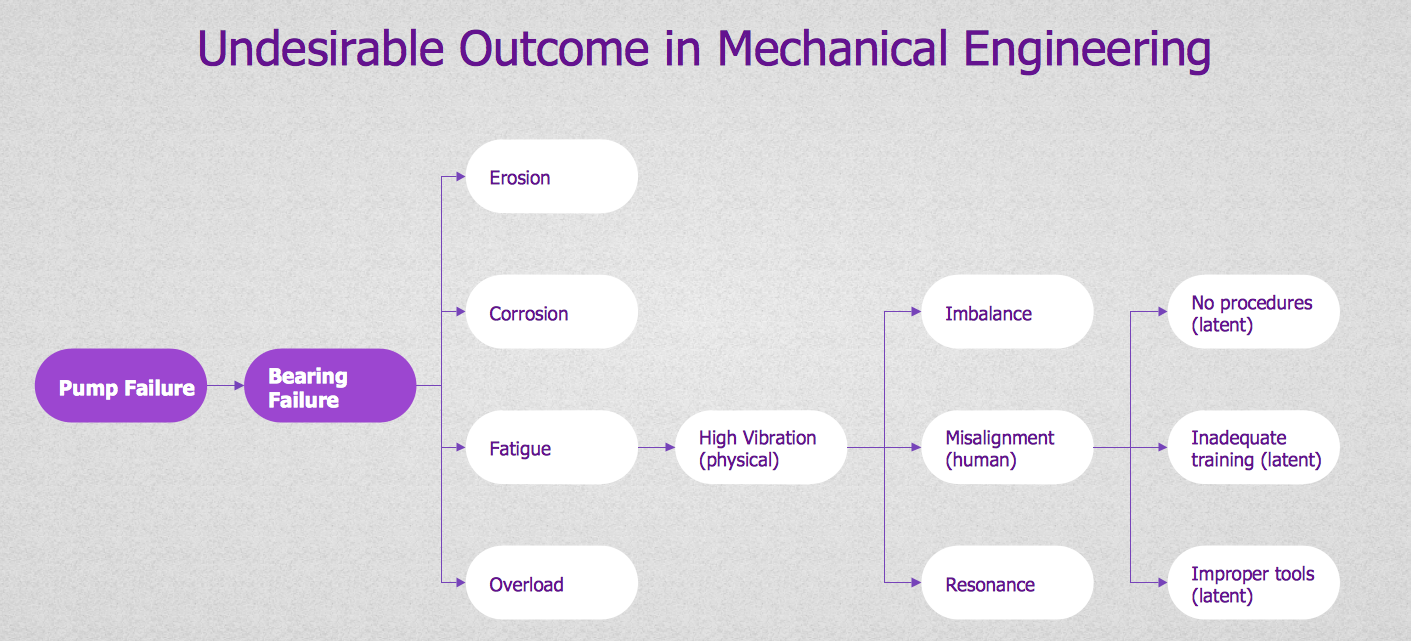
Picture: Decision Making
ConceptDraw
DIAGRAM 18