Sales Organization
Sales Dashboard Solution
The Sales Dashboard Solution gives users the ability to use live data to drive displays that show sales performance in a wide variety of graphs. By using ConceptDraw DIAGRAM dashboards software one obtain benefits:
- Generating detailed reports
- Align strategies and organizational goals
- Visually performance presenting
- Identifying negative trends
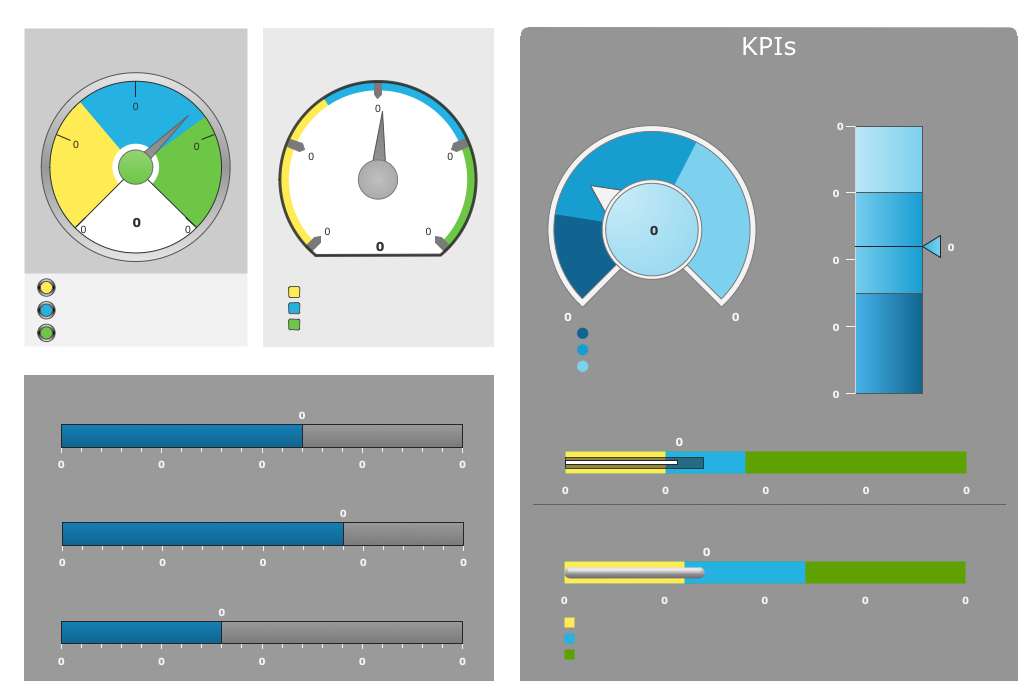
Pic. 1. Sales KPIs Dashboard Sample
THREE RELATED HOW TO's:
Sales teams are inherently competitive, so you don't need to invent extra ways to stimulate the competition. At the same time, you can provide the team with a sales dashboard shows company, team and personal KPI to make the competition clear.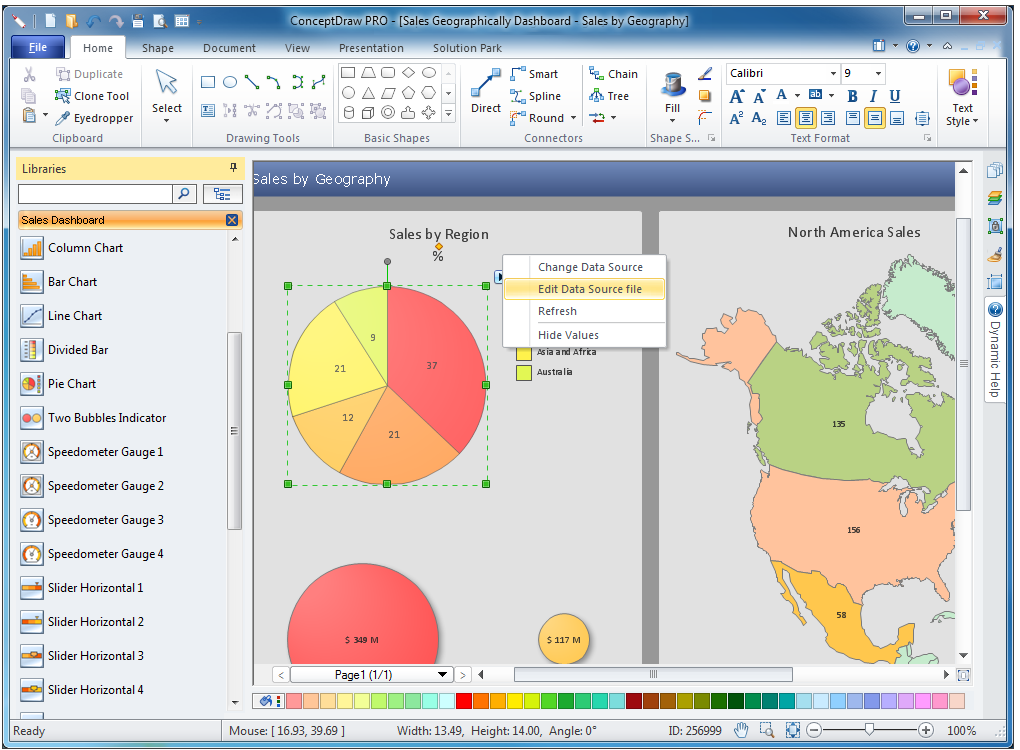
Picture: Sales Teams are Inherently Competitive
Visualizing sales data help you see the facts and KPIs about your sales process to make conclusions and see how your business can improve.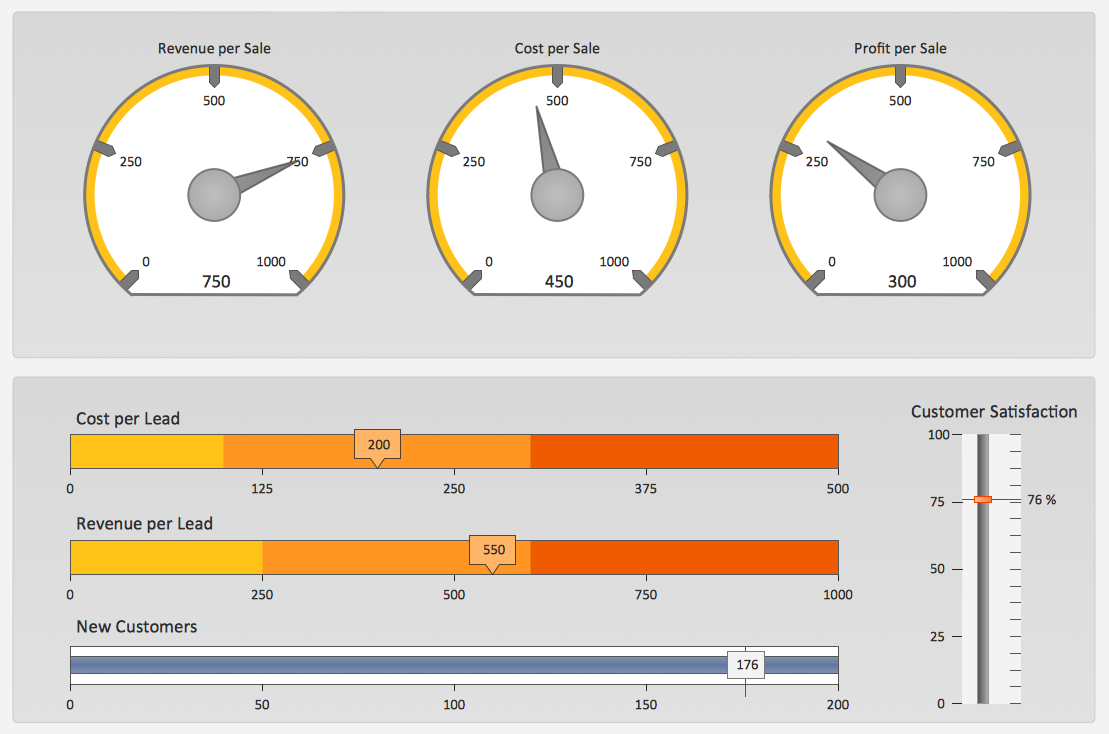
Picture: The Facts and KPIs
There are lots of ways you can visualize sales data, and the simplest way is using ConceptDraw Sales Dashboard solution for ConceptDraw DIAGRAM. You just need to connect your data to one of pre-designed dashboards, and then you can see dynamic picture of changes.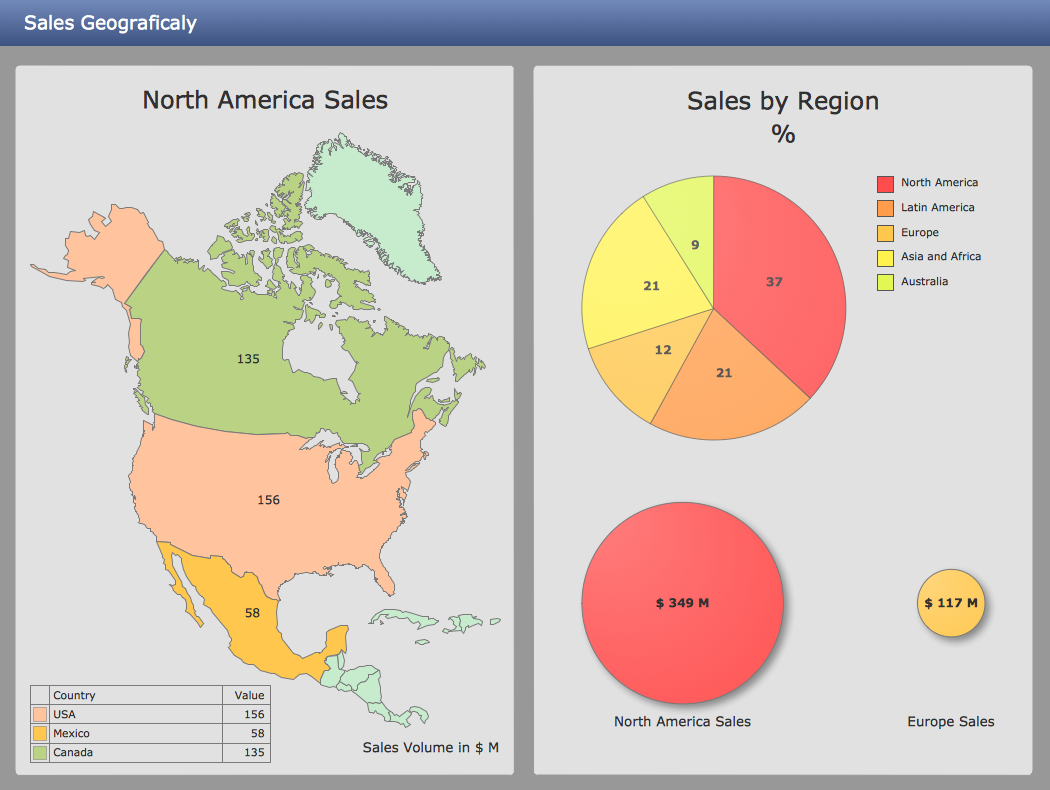
Picture: Ways You Can Visualize Sales Data
ConceptDraw
DIAGRAM 18