The Action Plan
Management and Planning
ConceptDraw OFFICE suite is a software for decision making and action plan. The Seven Management and Planning Tools is a set for such diagrams: Affinity Diagram, Relations Diagram, Prioritization Matrix, Root Cause Analysis Tree Diagram, Involvement Matrix, PERT Chart, Risk Diagram (PDPC).
For the action planning define people and groups involvement in corrective actions by roles, identify logical sequences of scheduled actions and critical path of problem solving, identify possible risks of action plan and propose preventive actions.
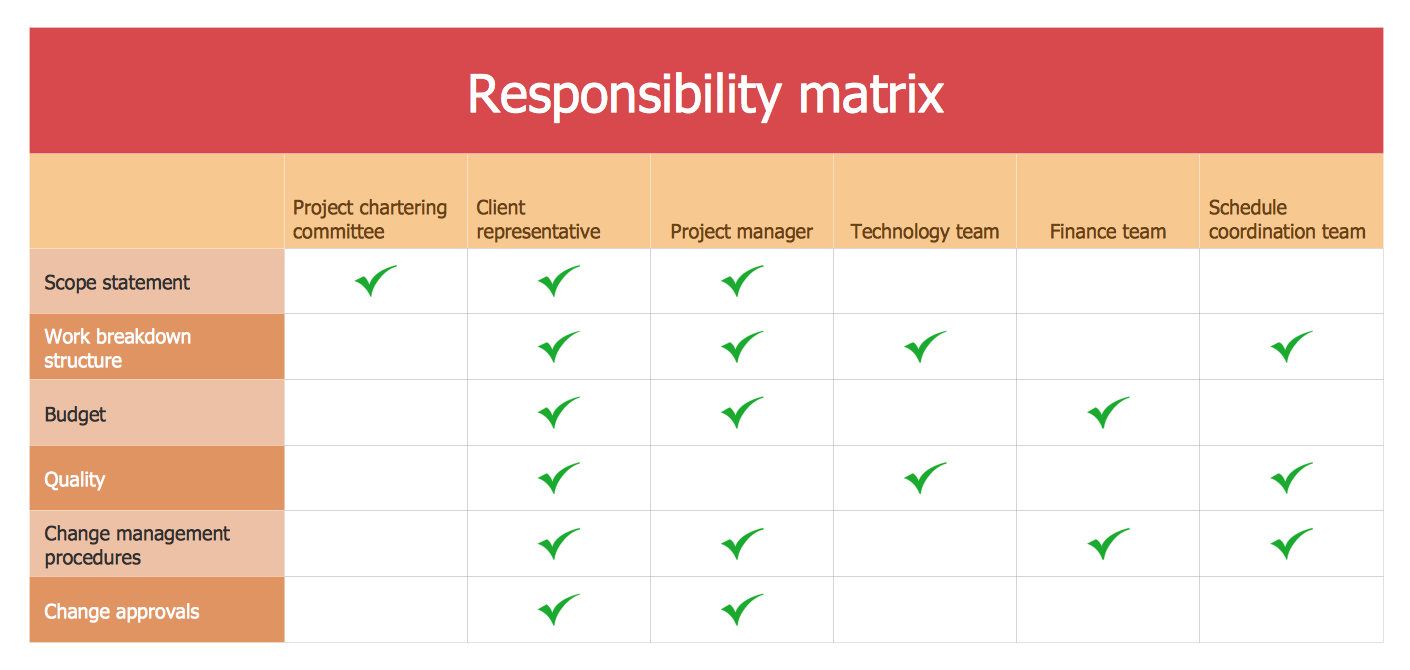
Pic.1 Action Plan. Involvement matrix — Distribution of Responsibility
The Involvement Matrix defines the level of involvement and nature of participation. The diagram shows the degree of involvement for all identified parties in the execution of corrective actions.
See also:
TEN RELATED HOW TO's:
The Sales Process is a complex approach for selling a product or service which assumes many steps including the sales planning, realization of the sales marketing and management strategies, sales process analysis, etc. Now we have a ConceptDraw DIAGRAM software extended with unique Sales Flowcharts solution from the Marketing area of ConceptDraw Solution Park which ideally suits for the planning and realization the company's sales process.
Picture: The Sales Process
Related Solution:
ConceptDraw DIAGRAM software extended with Matrices Solution from the Marketing Area of ConceptDraw Solution Park offers you the possibility to develop the Ansoff Matrix of any complexity.
Picture: Ansoff Matrix
Related Solution:
This sample shows the Perceptual map. It was created in ConceptDraw DIAGRAM diagramming and vector drawing software using the Matrices Solution from the Marketing area of ConceptDraw Solution Park.
Perception Mapping helps organizations measure and transform all aspects of their business, people and culture. Perception Mapping allows to represent the complex relationships graphically, helps identify potential problems of the organization and make the best decisions.
Picture: Business Tools Perceptual Mapping
Related Solution:
Historical reference about the Gantt chart.
Picture: What is Gantt Chart (historical reference)
A flowchart can take any process and distil it into a series of actions or decisions; it is a versatile and simple form of diagram that can be used to describe situations in any field, and is easily understood by everyone. They are used frequently in business to document workflows from all areas of a company - they can show accounting purchase orders, human resource recruitment strategy, or a product life cycle.
ConceptDraw DIAGRAM diagramming and vector drawing software extended with Flowcharts Solution from the Diagrams Area of ConceptDraw Solution Park is a perfect powerful tool for extremely easy designing professional looking Flow Diagram.
Picture: Flow Diagram
Related Solution:
Accounts Payable Process Flow Chart - ConceptDraw DIAGRAM diagramming and vector drawing software extended with Accounting Flowcharts Solution provides the useful tools that will help you create easily and quickly.
The Accounts Payable Process Flow Chart is very popular and widely used type of accounting flowcharts. Now their designing is simple thanks to the Accounting Flowcharts Solution that provides the Accounting Flowcharts library of predesigned commonly-used shapes and a set of templates and samples.
Picture: Accounts Payable Process Flow Chart
Related Solution:
ConceptDraw DIAGRAM diagramming and vector drawing software extended with Mac OS User Interface Solution from the Software Development area is a powerful Mac OS GUI Software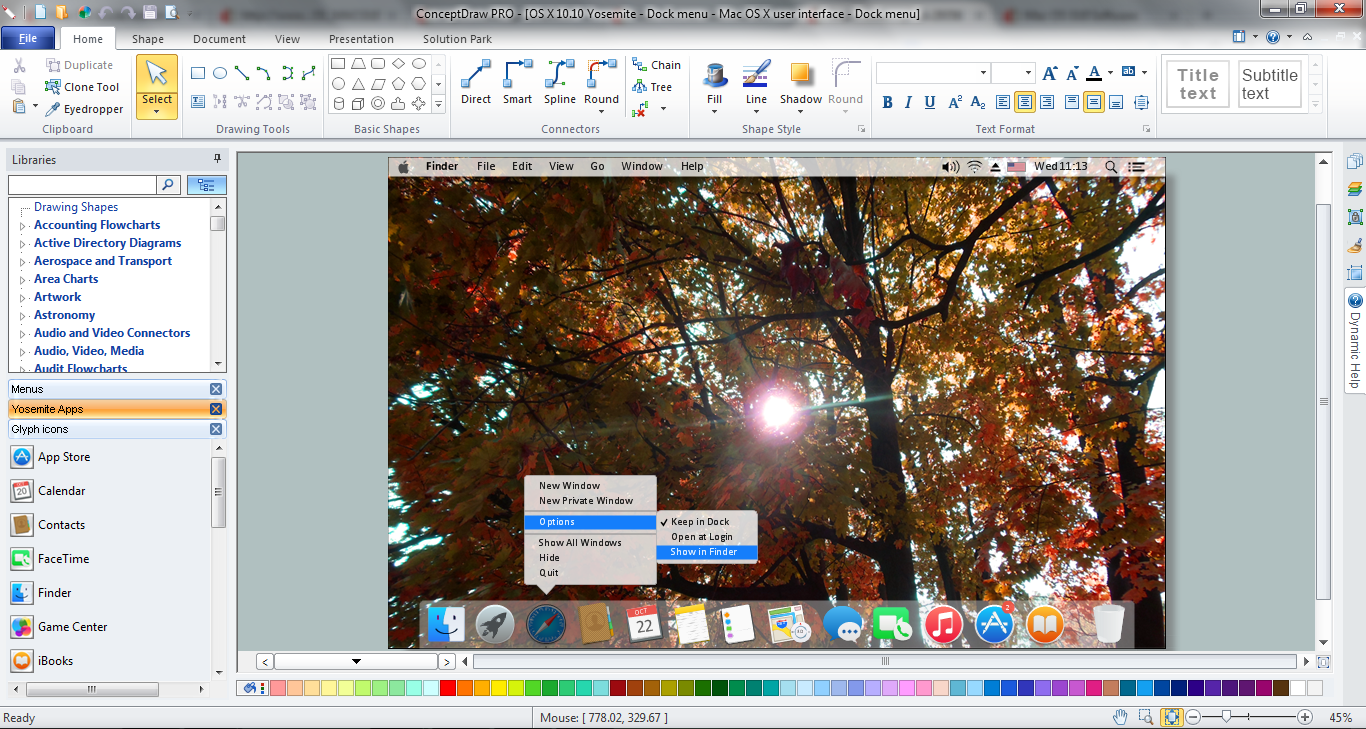
Picture: Mac OS GUI Software
Related Solution:
ConceptDraw MINDMAP is a powerful business and personal productivity software application that provides visual organization and access to information for individuals and organizations.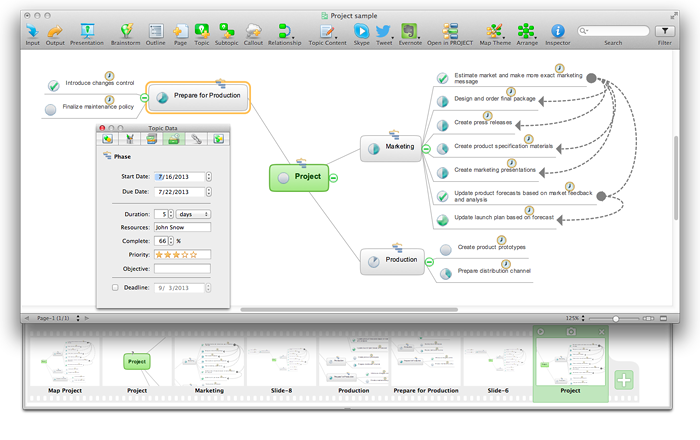
Picture: ConceptDraw MINDMAP :Brainstorming, Mind Mapping for macOS and Windows
Project timeline is a type of chart which allows visually represent the chronology of works for the project, placing the key points of the project (milestones) on a timescale.
You need to make professional looking project timeline? Create it with ConceptDraw DIAGRAM! ConceptDraw DIAGRAM extended with Timeline Diagrams Solution from the Management Area is the best timeline diagrams software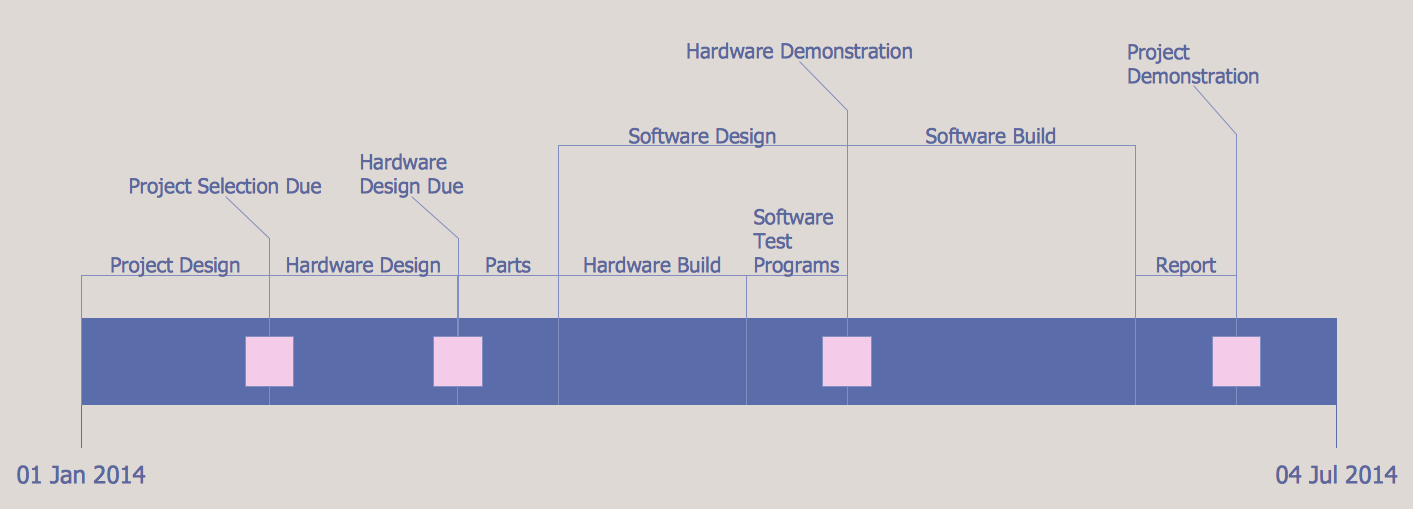
Picture: Project Timeline
Related Solution:
The Building Plans area of ConceptDraw Solution Park includes a set of solutions of Interior Design. The Interior Design solutions for ConceptDraw DIAGRAM allow you simply and quickly create the professional looking Building Plans that will help you to design, redesign your room, flat, home, office, cafe or any other building. Having the ready plan of the rooms you can easy rearrange the furniture, interior objects on the plan and see the future result at once.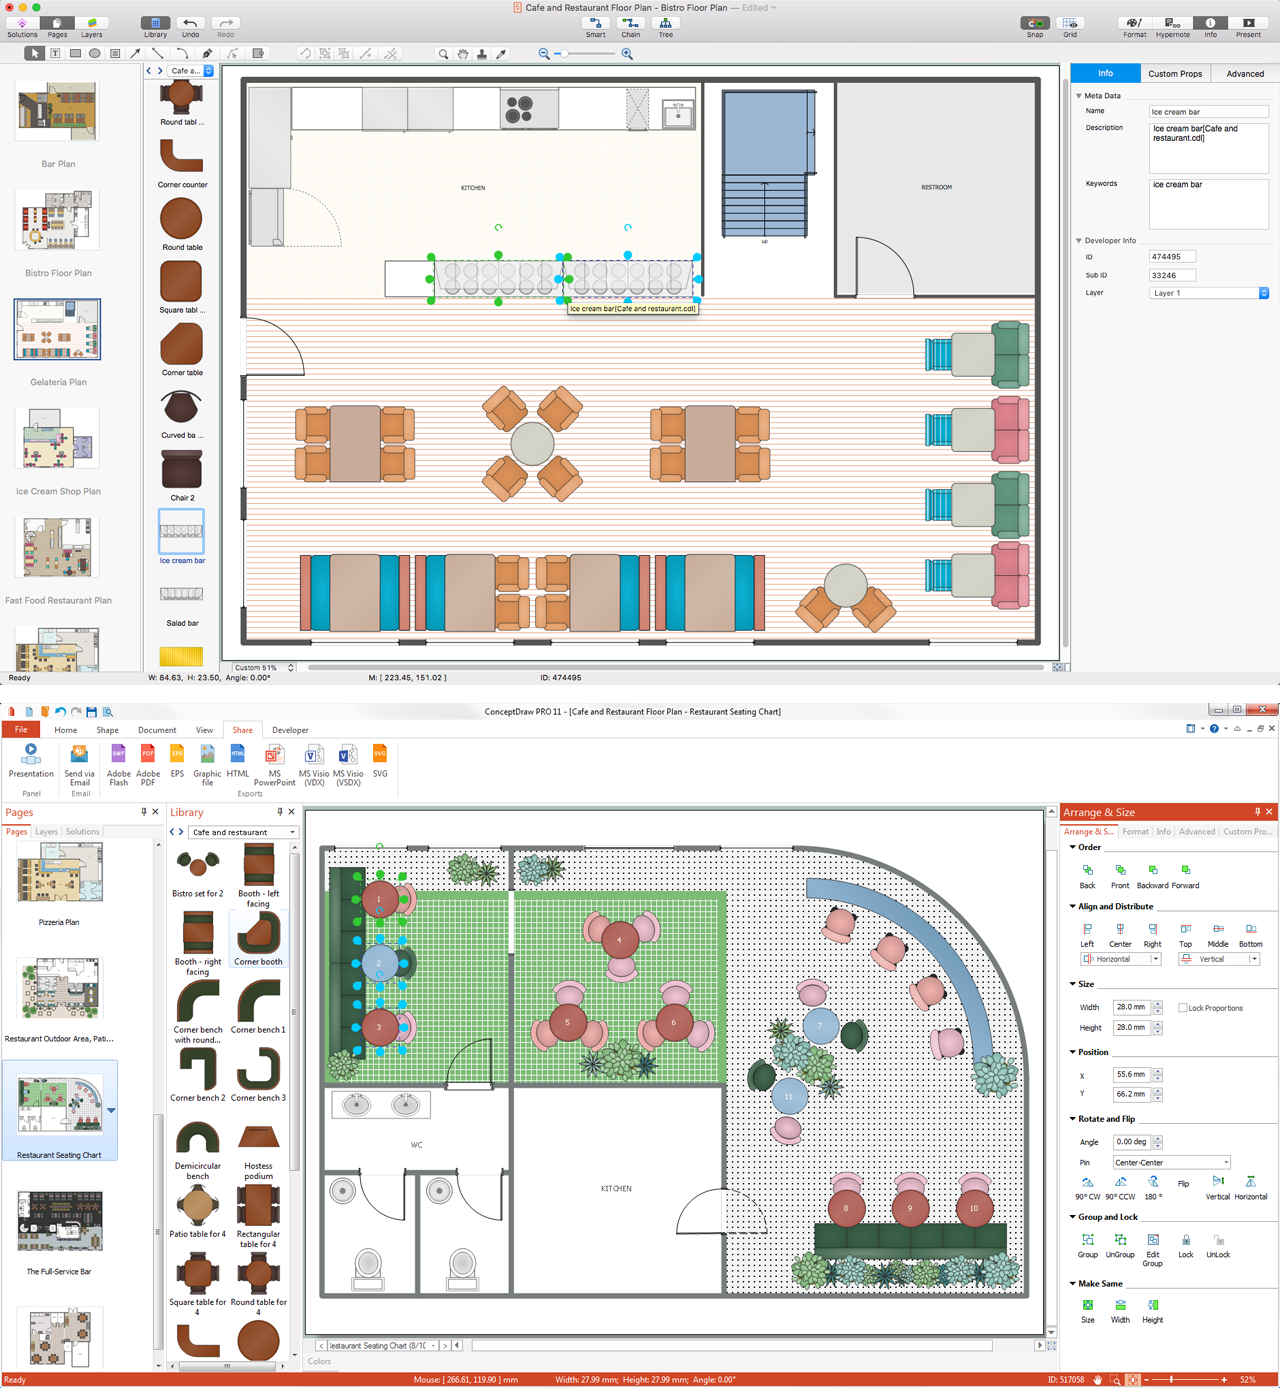
Picture: Interior Design Software. Building Plan Examples
Related Solution: