Radar Chart
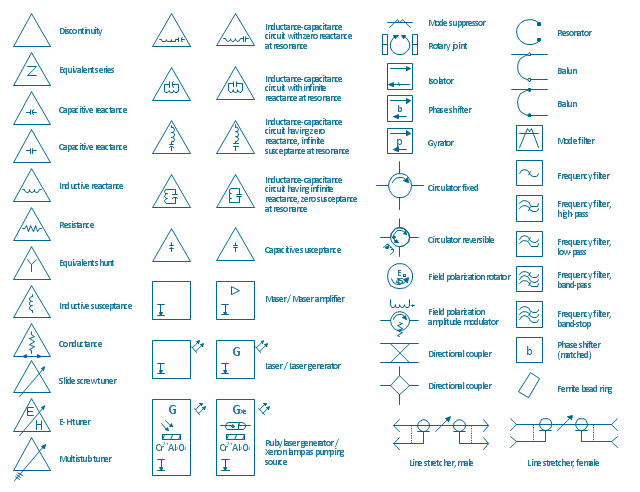
This sample shows the Radar Chart that compares the internet dimensions in the four countries. The Radar Chart represents the multivariate data as a two-dimensional chart with three or more variables displayed on the axes that start in one point. The Radar Charts are used in the quality management, business, analytics and sport.The vector stencils library "VHF UHF SHF" contains 52 symbols for VHF, UHF, and SHF circuit design, including capacitance measurers, nonreciprocal devices, modulators, phase shifters, field polarization devices, and filters.
"Very high frequency (VHF) is the ITU-designated range of radio frequency electromagnetic waves from 30 MHz to 300 MHz, with corresponding wavelengths of one to ten meters. Frequencies immediately below VHF are denoted high frequency (HF), and the next higher frequencies are known as ultra high frequency (UHF).
Common uses for VHF are FM radio broadcasting, television broadcasting, land mobile stations (emergency, business, private use and military), long range data communication up to several tens of kilometres with radio modems, amateur radio, and marine communications. Air traffic control communications and air navigation systems (e.g. VOR, DME & ILS) work at distances of 100 kilometres or more to aircraft at cruising altitude.
VHF was previously used for analog television stations in the US." [Very high frequency. Wikipedia]
"Ultra-high frequency (UHF) designates the ITU radio frequency range of electromagnetic waves between 300 MHz and 3 GHz (3,000 MHz), also known as the decimetre band or decimetre wave as the wavelengths range from one to ten decimetres; that is 1 decimetre to 1 metre. Radio waves with frequencies above the UHF band fall into the SHF (super-high frequency) or microwave frequency range. Lower frequency signals fall into the VHF (very high frequency) or lower bands. UHF radio waves propagate mainly by line of sight; they are blocked by hills and large buildings although the transmission through building walls is high enough for indoor reception. They are used for television broadcasting (digital and analogue), cordless phones, walkie-talkies, satellite communication, and numerous other applications.
The IEEE defines the UHF radar band as frequencies between 300 MHz and 1 GHz. Two other IEEE radar band overlap the ITU UHF band: the L band between 1 and 2 GHz and the S band between 2 and 4 GHz." [Ultra high frequency. Wikipedia]
"Super high frequency (or SHF) is the ITU designation for radio frequencies (RF) in the range of 3 GHz and 30 GHz. This band of frequencies is also known as the centimetre band or centimetre wave as the wavelengths range from ten to one centimetres. These frequencies fall within the microwave band, so radio waves with these frequencies are called microwaves. The small wavelength of microwaves allows them to be directed in narrow beams by aperture antennas such as parabolic dishes, so they are used for point-to-point communication and data links, and for radar. This frequency range is used for most radar transmitters, microwave ovens, wireless LANs, cell phones, satellite communication, microwave radio relay links, and numerous short range terrestrial data links. The commencing wireless USB technology will be using approximately 1/ 3 of this spectrum.
Frequencies in the SHF range are often referred to by their IEEE radar band designations: S, C, X, Ku, K, or Ka band, or by similar NATO or EU designations." [Super high frequency. Wikipedia]
The shapes example "Design elements - VHF UHF SHF" was drawn using the ConceptDraw PRO diagramming and vector drawing software extended with the Electrical Engineering solution from the Engineering area of ConceptDraw Solution Park.
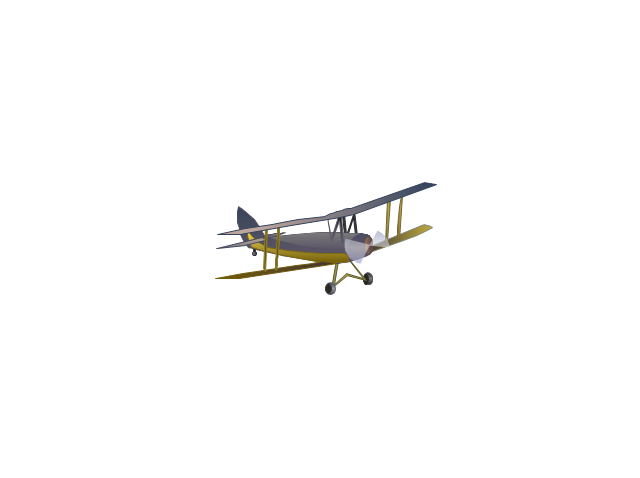
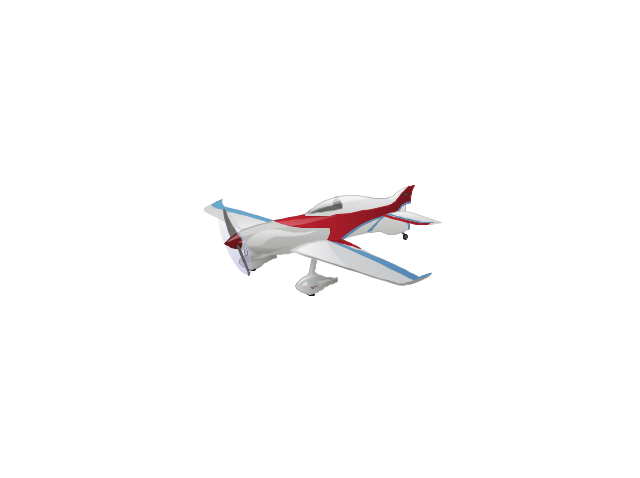
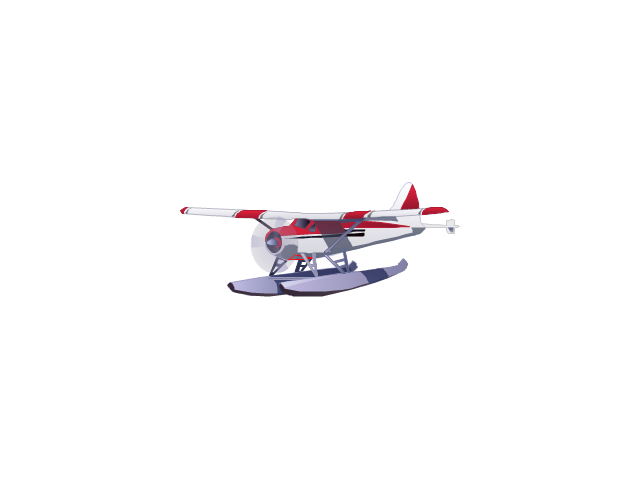
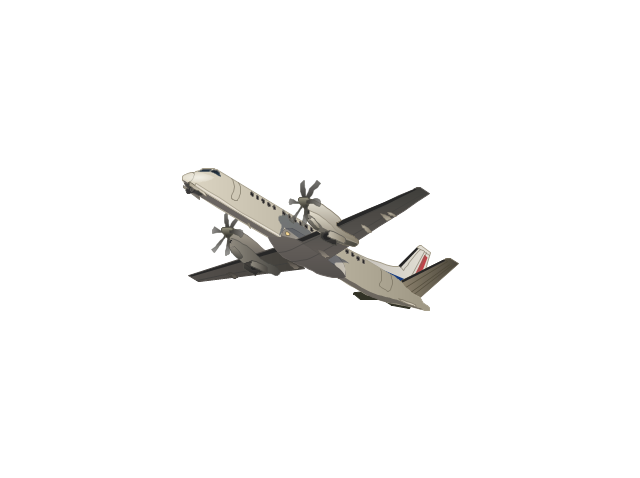
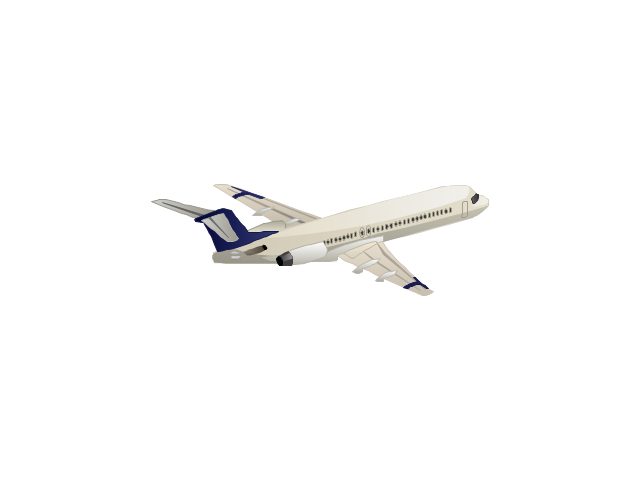
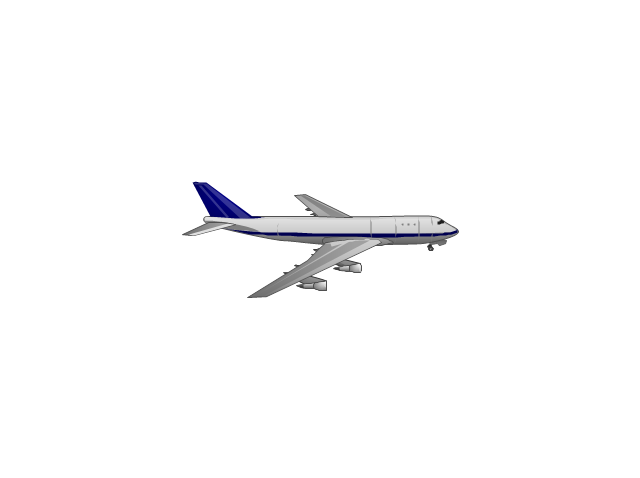
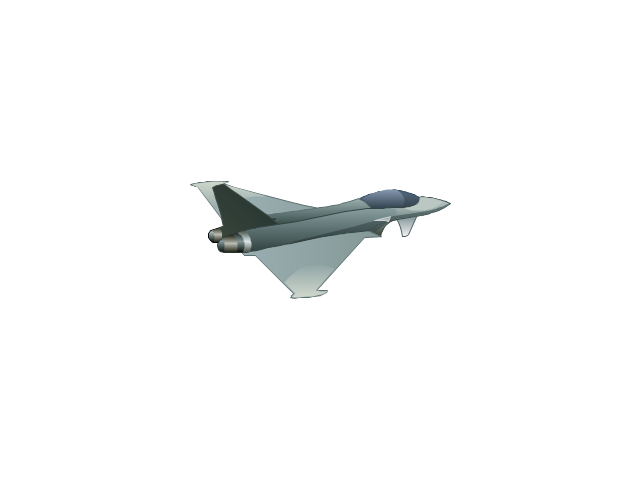
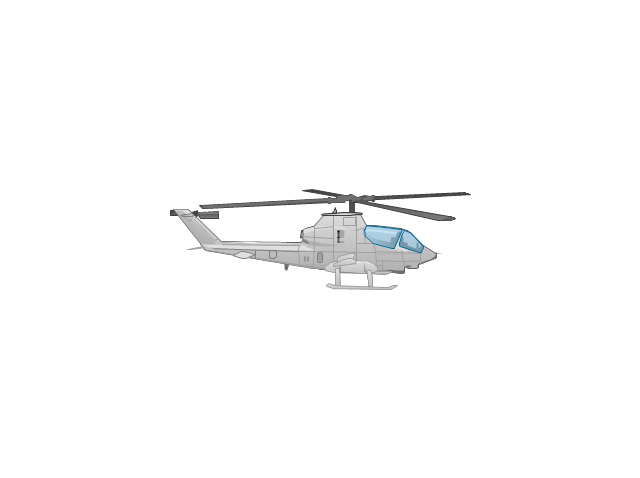
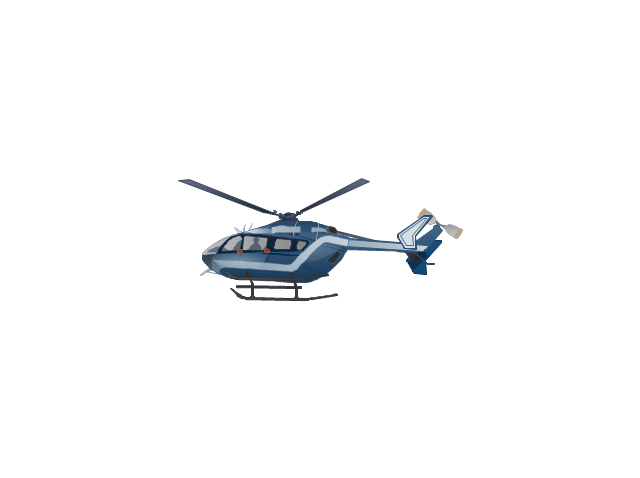
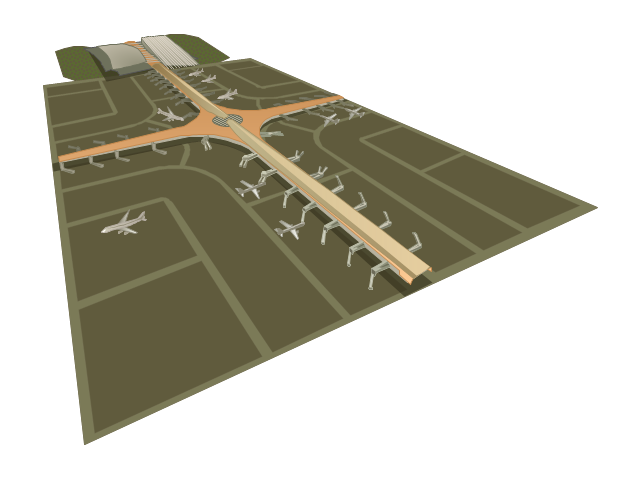
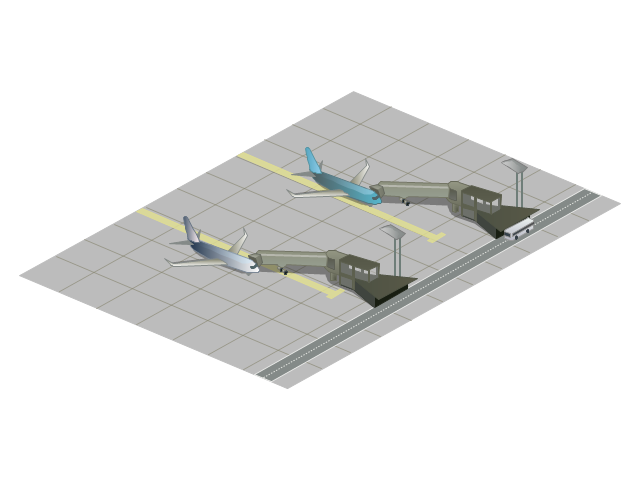
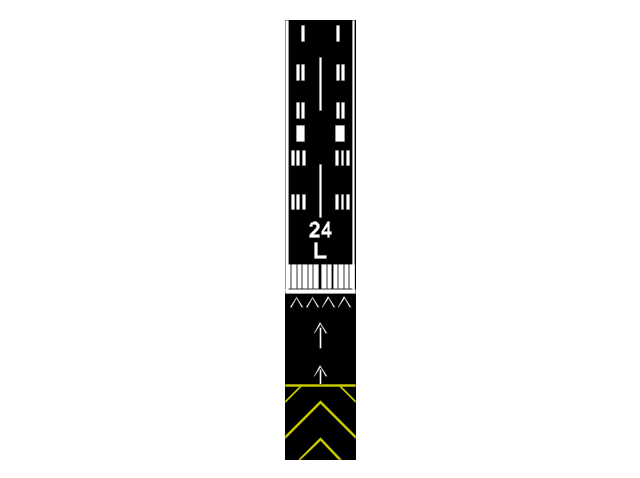
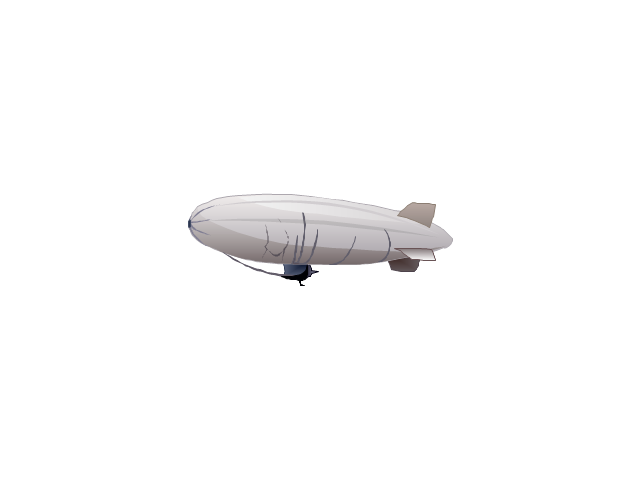
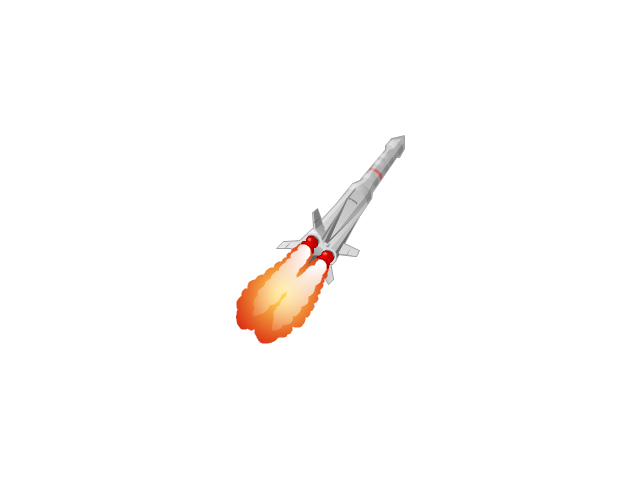
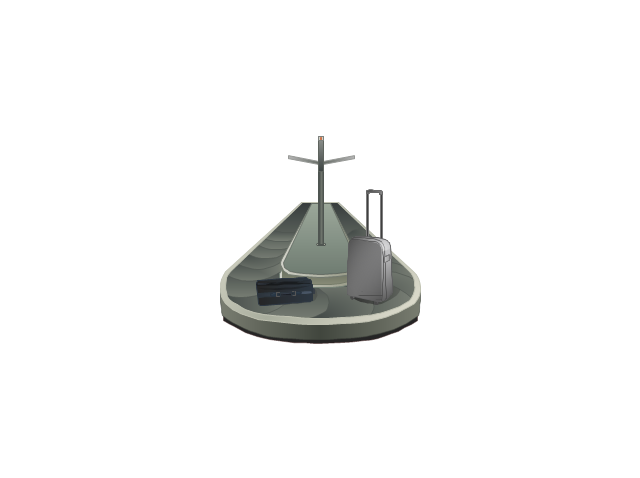
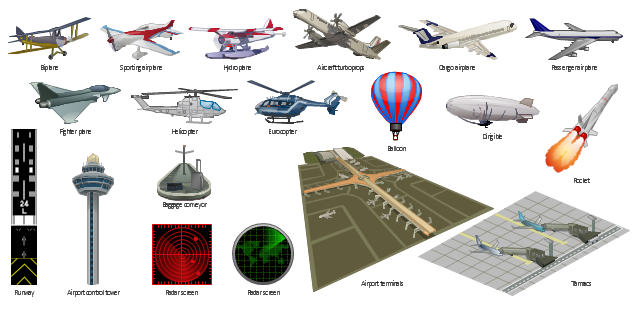
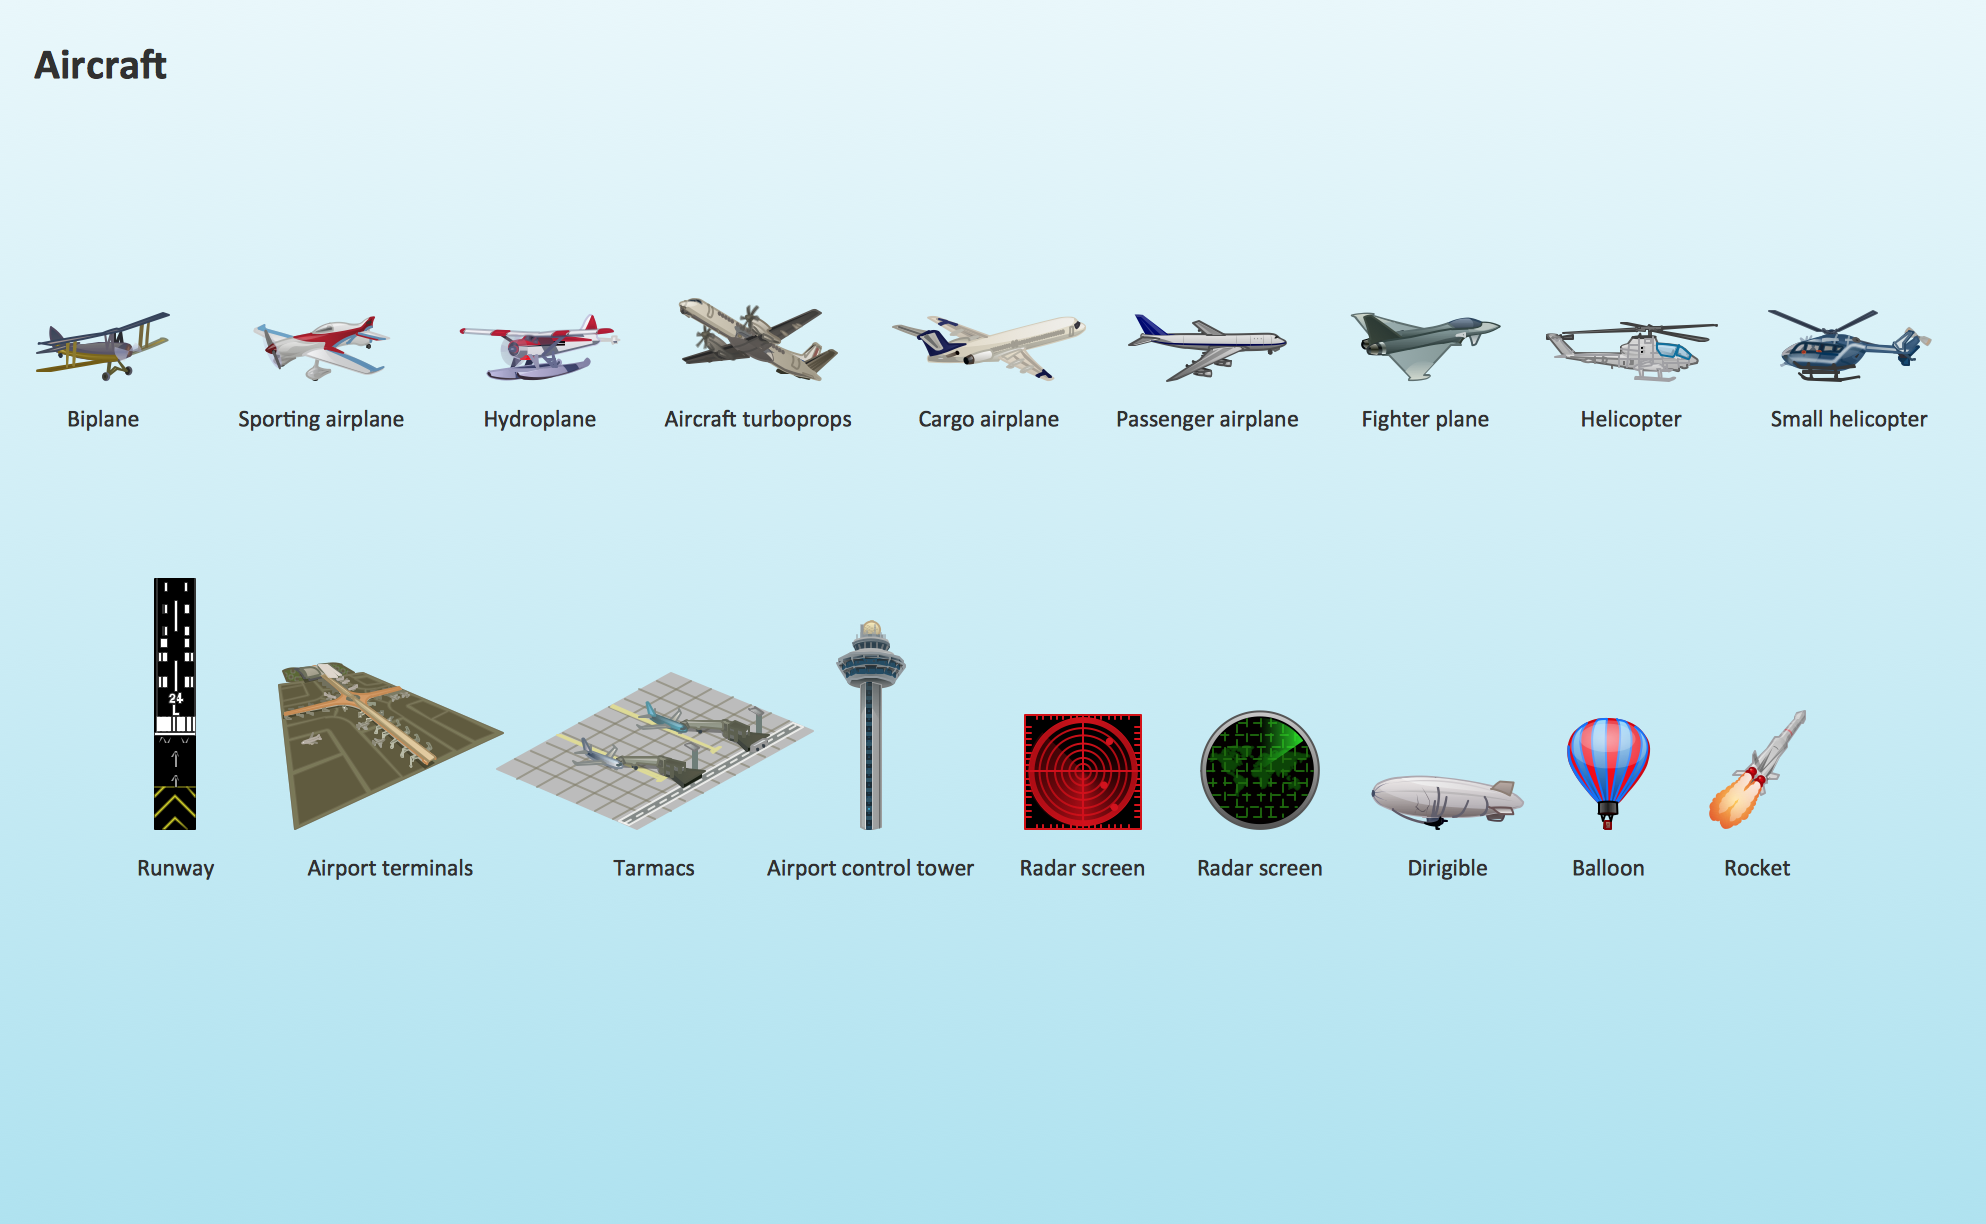
The vector stencils library "Aircraft" contains 19 clip art images for creating aviation illustrations, presentation slides, infographics and webpages using the ConceptDraw PRO diagramming and vector drawing software.
"An aircraft is a machine that is able to fly by gaining support from the air, or, in general, the atmosphere of a planet. It counters the force of gravity by using either static lift or by using the dynamic lift of an airfoil, or in a few cases the downward thrust from jet engines.
The human activity that surrounds aircraft is called aviation. Crewed aircraft are flown by an onboard pilot, but unmanned aerial vehicles may be remotely controlled or self-controlled by onboard computers. Aircraft may be classified by different criteria, such as lift type, propulsion, usage and others." [Aircraft. Wikipedia]
The vector stencils library "Aircraft" is included in the Aerospace and Transport solution from the Illustrations area of ConceptDraw Solution Park.
www.conceptdraw.com/ solution-park/ illustrations-aerospace-transport
Spider Chart Template
This sample shows the Spider Chart that represents the budget and spending for one organization and allows to compare them. The multivariate data are represented on the Spider Chart as a two-dimensional chart with four or more variables displayed on the axes that start in one point. The Spider Charts are used in the management, business and sport.The vector clipart library Aircraft contains 19 images of aerial vehicles and aviation objects. Use the vector stencils library Aircraft to draw aviation illustrations, presentation slides, infographics and diagrams using the ConceptDraw PRO diagramming and vector drawing software. "Civil aviation is one of two major categories of flying, representing all non-military aviation, both private and commercial. Most of the countries in the world are members of the International Civil Aviation Organization (ICAO) and work together to establish common standards and recommended practices for civil aviation through that agency. Civil aviation includes two major categories: - Scheduled air transport, including all passenger and cargo flights operating on regularly scheduled routes; and - General aviation (GA), including all other civil flights, private or commercial. ... Some countries also make a regulatory distinction based on whether aircraft are flown for hire like: - Commercial aviation includes most or all flying done for hire, particularly scheduled service on airlines; and - Private aviation includes pilots flying for their own purposes (recreation, business meetings, etc.) without receiving any kind of remuneration. All scheduled air transport is commercial, but general aviation can be either commercial or private. Normally, the pilot, aircraft, and operator must all be authorized to perform commercial operations through separate commercial licensing, registration, and operation certificates." [Civil aviation. Wikipedia] The design elements library Aircraft is included in the Aerospace and Transport solution from the Illustration area of ConceptDraw Solution Park.
Flowchart Software
Flowchart is a simple diagram, map or graphical schematic representation the sequence of actions within a process. It is ideal for displaying how a process currently flows or can function ideally. The Flowcharts let define the steps and boundaries of a process, uncover problems or miscommunications. The Flowcharts are widely used in education, software development, business, economics, thanks to their visuality they are ideal for presentations, reports, for using on conferences to help the audience comprehend the content better, or easy find flaws in a process flow diagrams. ConceptDraw DIAGRAM is professional flowcharts software and feature-rich flowchart maker, which supports Mac OS X and Windows. It contains at ConceptDraw Solution Park a rich set of stencils and professional flowchart symbols for design. It lets create simply professional-looking Flowcharts based on thousand free flowchart templates, colored symbols and examples. ConceptDraw DIAGRAM is a 3 times cheaper alternative to MS Visio available for both Mac and PC. It’s is another full featured business and technical diagramming application that can easily take care of Visio files within OS X. Another bonus with ConceptDraw DIAGRAM – it's cross-platform. You can work on a document in both OS X and Windows, skipping Visio entirely.
Aircraft - Design Elements
The vector stencils library Aircraft contains clipart of aerospace objects, transportation vehicles, office buildings, and ancillary facilities for ConceptDraw DIAGRAM diagramming and vector drawing software.Chart Maker for Presentations
Easy charting software comes with beautiful chart templates and examples. This makes it easy to create professional charts without prior experience.
 Aerospace and Transport
This solution extends ConceptDraw DIAGRAM software with templates, samples and library of vector clipart for drawing the Aerospace and Transport Illustrations. It contains clipart of aerospace objects and transportation vehicles, office buildings and anci
 Telecommunication Network Diagrams
Telecommunication Network Diagrams solution extends ConceptDraw DIAGRAM software with samples, templates, and great collection of vector stencils to help the specialists in a field of networks and telecommunications, as well as other users to create Computer systems networking and Telecommunication network diagrams for various fields, to organize the work of call centers, to design the GPRS networks and GPS navigational systems, mobile, satellite and hybrid communication networks, to construct the mobile TV networks and wireless broadband networks.
This work flow chart sample was redesigned from the picture "Weather Forecast" from the article "Simulation Workflows".
[iaas.uni-stuttgart.de/ forschung/ projects/ simtech/ sim-workflows.php]
"(1) The weather is predicted for a particular geological area. Hence, the workflow is fed with a model of the geophysical environment of ground, air and water for a requested area.
(2) Over a specified period of time (e.g. 6 hours) several different variables are measured and observed. Ground stations, ships, airplanes, weather balloons, satellites and buoys measure the air pressure, air/ water temperature, wind velocity, air humidity, vertical temperature profiles, cloud velocity, rain fall, and more.
(3) This data needs to be collected from the different sources and stored for later access.
(4) The collected data is analyzed and transformed into a common format (e.g. Fahrenheit to Celsius scale). The normalized values are used to create the current state of the atmosphere.
(5) Then, a numerical weather forecast is made based on mathematical-physical models (e.g. GFS - Global Forecast System, UKMO - United Kingdom MOdel, GME - global model of Deutscher Wetterdienst). The environmental area needs to be discretized beforehand using grid cells. The physical parameters measured in Step 2 are exposed in 3D space as timely function. This leads to a system of partial differential equations reflecting the physical relations that is solved numerically.
(6) The results of the numerical models are complemented with a statistical interpretation (e.g. with MOS - Model-Output-Statistics). That means the forecast result of the numerical models is compared to statistical weather data. Known forecast failures are corrected.
(7) The numerical post-processing is done with DMO (Direct Model Output): the numerical results are interpolated for specific geological locations.
(8) Additionally, a statistical post-processing step removes failures of measuring devices (e.g. using KALMAN filters).
(9) The statistical interpretation and the numerical results are then observed and interpreted by meteorologists based on their subjective experiences.
(10) Finally, the weather forecast is visualized and presented to interested people." [iaas.uni-stuttgart.de/ forschung/ projects/ simtech/ sim-workflows.php]
The example "Workflow diagram - Weather forecast" was drawn using the ConceptDraw PRO diagramming and vector drawing software extended with the Workflow Diagrams solution from the Business Processes area of ConceptDraw Solution Park.
- Spider Chart Template | Radar Chart | Column Chart Software ...
- Spider Chart Template | Radar Chart | Chart Maker for Presentations ...
- Radar Chart | Design elements - VHF UHF SHF | Aircraft - Vector ...
- Radar Chart | Spider Chart Template | Workflow diagram - Weather ...
- Radar Chart | Aircraft - Vector stencils library | Aircraft - Design ...
- Radar Chart | Aircraft - Design Elements | Spider Chart Template ...
- Radar Chart | Spider Chart Template | Percentage Spider Chart ...
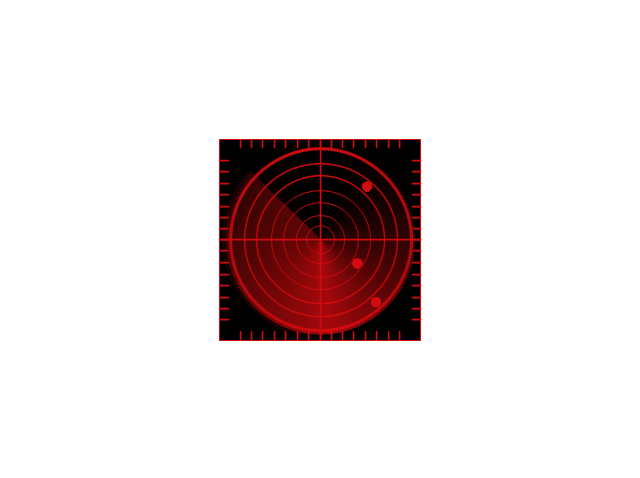
- Radar Symbol
- Spider Chart Template | Chart Maker for Presentations | Radar Chart ...
- Spider Chart Template | Radar Chart | MS Visio Look a Like ...
- Radar Chart | Spider Chart Template | Aircraft - Design Elements ...
- Spider Chart Template | Radar Chart | Column Chart Software ...
- Radar Chart | Bus Network Topology Diagram | Process Flowchart ...
- Radar Chart | Spider Chart Template | Column Chart Software ...
- Spider Chart Template | Radar Chart | Hiring Process | Process ...
- Spider Chart Template | Radar Chart | Flowchart Software | Spider ...
- Flowchart Software | Radar Chart | Blank Scatter Plot | Free Blank ...
- All Analog Digital Mobile Satellite Radar Communications ...
- Spider Chart Template | Percentage Spider Chart | Radar Chart ...
- Radar Tower Icon

