- Electric and Telecom Plans Free
- Fire and Emergency Plans Free
- Floor Plans Free
- Plant Layout Plans Free
- School and Training Plans Free
- Seating Plans Free
- Security and Access Plans Free
- Site Plans Free
- Sport Field Plans Free
- Business Process Diagrams Free
- Business Process Mapping Free
- Classic Business Process Modeling Free
- Cross-Functional Flowcharts Free
- Event-driven Process Chain Diagrams Free
- IDEF Business Process Diagrams Free
- Logistics Flow Charts Free
- Workflow Diagrams Free
- ConceptDraw Dashboard for Facebook Free
- Mind Map Exchange Free
- MindTweet Free
- Note Exchange Free
- Project Exchange Free
- Social Media Response Free
- Active Directory Diagrams Free
- AWS Architecture Diagrams Free
- Azure Architecture Free
- Cisco Network Diagrams Free
- Cisco Networking Free
- Cloud Computing Diagrams Free
- Computer Network Diagrams Free
- Google Cloud Platform Free
- Interactive Voice Response Diagrams Free
- Network Layout Floor Plans Free
- Network Security Diagrams Free
- Rack Diagrams Free
- Telecommunication Network Diagrams Free
- Vehicular Networking Free
- Wireless Networks Free
- Comparison Dashboard Free
- Composition Dashboard Free
- Correlation Dashboard Free
- Frequency Distribution Dashboard Free
- Meter Dashboard Free
- Spatial Dashboard Free
- Status Dashboard Free
- Time Series Dashboard Free
- Basic Circle-Spoke Diagrams Free
- Basic Circular Arrows Diagrams Free
- Basic Venn Diagrams Free
- Block Diagrams Free
- Concept Maps Free
- Family Tree Free
- Flowcharts Free
- Basic Area Charts Free
- Basic Bar Graphs Free
- Basic Divided Bar Diagrams Free
- Basic Histograms Free
- Basic Line Graphs Free
- Basic Picture Graphs Free
- Basic Pie Charts Free
- Basic Scatter Diagrams Free
- Aerospace and Transport Free
- Artwork Free
- Audio, Video, Media Free
- Business and Finance Free
- Computers and Communications Free
- Holiday Free
- Manufacturing and Maintenance Free
- Nature Free
- People Free
- Presentation Clipart Free
- Safety and Security Free
- Analog Electronics Free
- Audio and Video Connectors Free
- Basic Circuit Diagrams Free
- Chemical and Process Engineering Free
- Digital Electronics Free
- Electrical Engineering Free
- Electron Tube Circuits Free
- Electronic Block Diagrams Free
- Fault Tree Analysis Diagrams Free
- GHS Hazard Pictograms Free
- Home Automation and Wiring Free
- Mechanical Engineering Free
- One-line Diagrams Free
- Power Сircuits Free
- Specification and Description Language (SDL) Free
- Telecom and AV Circuits Free
- Transport Hazard Pictograms Free
- Data-driven Infographics Free
- Pictorial Infographics Free
- Spatial Infographics Free
- Typography Infographics Free
- Calendars Free
- Decision Making Free
- Enterprise Architecture Diagrams Free
- Fishbone Diagrams Free
- Organizational Charts Free
- Plan-Do-Check-Act (PDCA) Free
- Seven Management and Planning Tools Free
- SWOT and TOWS Matrix Diagrams Free
- Timeline Diagrams Free
- Australia Map Free
- Continent Maps Free
- Directional Maps Free
- Germany Map Free
- Metro Map Free
- UK Map Free
- USA Maps Free
- Customer Journey Mapping Free
- Marketing Diagrams Free
- Matrices Free
- Pyramid Diagrams Free
- Sales Dashboard Free
- Sales Flowcharts Free
- Target and Circular Diagrams Free
- Cash Flow Reports Free
- Current Activities Reports Free
- Custom Excel Report Free
- Knowledge Reports Free
- MINDMAP Reports Free
- Overview Reports Free
- PM Agile Free
- PM Dashboards Free
- PM Docs Free
- PM Easy Free
- PM Meetings Free
- PM Planning Free
- PM Presentations Free
- PM Response Free
- Resource Usage Reports Free
- Visual Reports Free
- House of Quality Free
- Quality Mind Map Free
- Total Quality Management TQM Diagrams Free
- Value Stream Mapping Free
- Astronomy Free
- Biology Free
- Chemistry Free
- Language Learning Free
- Mathematics Free
- Physics Free
- Piano Sheet Music Free
- Android User Interface Free
- Class Hierarchy Tree Free
- Data Flow Diagrams (DFD) Free
- DOM Tree Free
- Entity-Relationship Diagram (ERD) Free
- EXPRESS-G data Modeling Diagram Free
- IDEF0 Diagrams Free
- iPhone User Interface Free
- Jackson Structured Programming (JSP) Diagrams Free
- macOS User Interface Free
- Object-Role Modeling (ORM) Diagrams Free
- Rapid UML Free
- SYSML Free
- Website Wireframe Free
- Windows 10 User Interface Free
Workflow Diagrams
The Workflow diagram is a specialized type of flowchart, which provides a general overview of a business process, depicts the process start and end points, all steps and actions composing it, direction of the workflow and connections between the steps in an order of their execution. In some cases, the process can return to the start point forming the closed system. The Workflow diagrams visually represent all tasks and actions needed to perform the process from start to finish, clarify the sequence of their execution. They help to identify resources required for the process implementation and visualize how the tasks will flow between these resources, allowing easier the process analysis, improvement, and defining potential weaknesses and critical areas.
Workflow diagrams depict the transferring of data, documents, and tasks during the performance of a work process. It is not an easy task to trace the task's or document's path, but the clearer the diagram is — the easier this process is. Presenting the process steps in a simple visual manner simplifies and makes the study and analysis of any work process effective. With the help of a Workflow diagram, it is possible not only oversee the task's path in as it relates to the overall process but also clarify which documents are associated with the tasks, the order in which work is completed and which people are responsible for the execution of each stage.
The diagrams of this type ensure employees better understanding their roles and allow providing unity within different departments. One of the main purposes of the Workflow diagrams is to help both teams and systems avoid mistakes, to improve the performance of the workflow processes, because only knowing all nuances of a workflow process becomes possible to optimize it, to discover its inherent weak points and eliminate them. All these abilities make the Workflow diagrams popular and often used.
The standardized symbols and shapes are commonly used in the Workflow diagrams design, the workflow steps are often represented by the boxes connected with arrows that indicate the flow from the beginning to end. The ConceptDraw DIAGRAM offers the most illustrative way of drawing the Workflow diagrams using the colorful and intuitive clipart images to depict the workflow steps.
Workflow Diagrams solution extends ConceptDraw DIAGRAM software with workflow examples and samples, workflow diagram template, and a library of workflow diagram symbols and pictorial vector clipart for drawing visual and intuitively understandable Workflow diagrams. Evaluate all advantages of professional workflow diagram software and design your pictorial Work flow chart or Work flow diagram easier than ever, use them for documentation and implementation purposes, export in a variety of common graphics formats and share with colleagues. Use this solution to extend the already wide area Work flow diagrams' applications that are used today in the manufacturing industry, software development, HR, medicine, banking and finance sphere, education, military, government, business, e-commerce, and many other fields.
-
Install this solution Free -
What I need to get started -
Solution Requirements - This solution requires the following products to be installed:
ConceptDraw DIAGRAM v18 - This solution requires the following products to be installed:
-
Compatibility - Sonoma (14), Sonoma (15)
MS Windows 10, 11 - Sonoma (14), Sonoma (15)
-
Support for this Solution -
Helpdesk
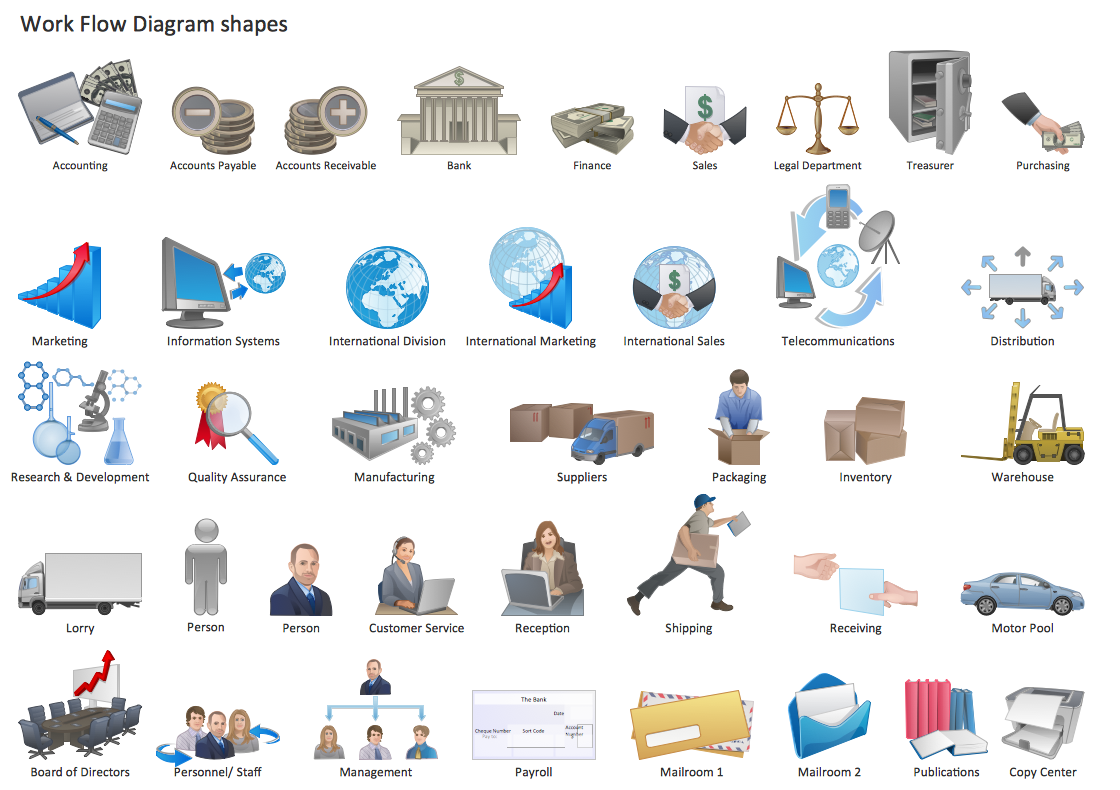
There is 1 library containing 39 vector shapes in the Workflow Diagrams solution.
Design Elements — Workflow Diagrams
Related News:
New Workflow Diagrams Solution to Better Describe Data, Documents, and Tasks Associated with Work ProcessesWorkflow Diagrams Examples
There are a few samples that you see on this page which were created in the ConceptDraw DIAGRAM application by using the Workflow Diagrams solution. Some of the solution's capabilities as well as the professional results which you can achieve are all demonstrated here on this page.
All source documents are vector graphic documents which are always available for modifying, reviewing and/or converting to many different formats, such as MS PowerPoint, PDF file, MS Visio, and many other graphic ones from the ConceptDraw Solution Park or ConceptDraw STORE. The Workflow Diagrams solution is available to all ConceptDraw DIAGRAM users to get installed and used while working in the ConceptDraw DIAGRAM diagramming and drawing software.
Template: Workflow Diagram
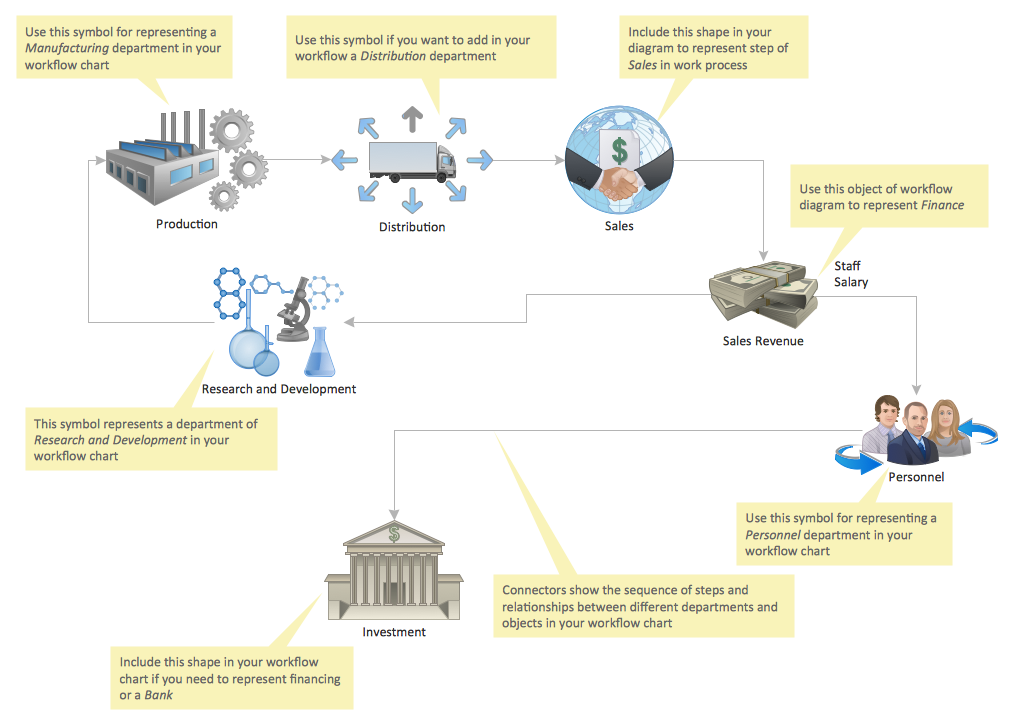
This diagram was created in ConceptDraw DIAGRAM using the "Workflow" library from the "Workflow Diagrams" solution. An experienced user spent 5 minutes creating this sample.
This is a simple Workflow diagram template that can be used as a successful quick-start at the Workflow diagram creation. The special workflow components and formal or informal flow diagramming techniques are used for describing the workflows. The different clipart workflow diagram symbols included in this diagram allow visualizing of all workflow components, the special departments, and specific processes in this template and in your own Workflow diagram. You can observe the clipart used to depict the manufacturing department, distribution department, research and development department, personnel department, sales process, finances, bank or other financial institution. A lot of other clipart are available from the solution's library. The directed flows and relationships between the steps in a workflow, between different departments and processes are represented by the connectors. The Workflow diagrams are a simple way to organize your work, to depict the flows of processes, and workflow diagram software ConceptDraw DIAGRAM extended with the Workflow Diagrams solution is your real help in their construction.
Example 1: Workflow Diagram — Business
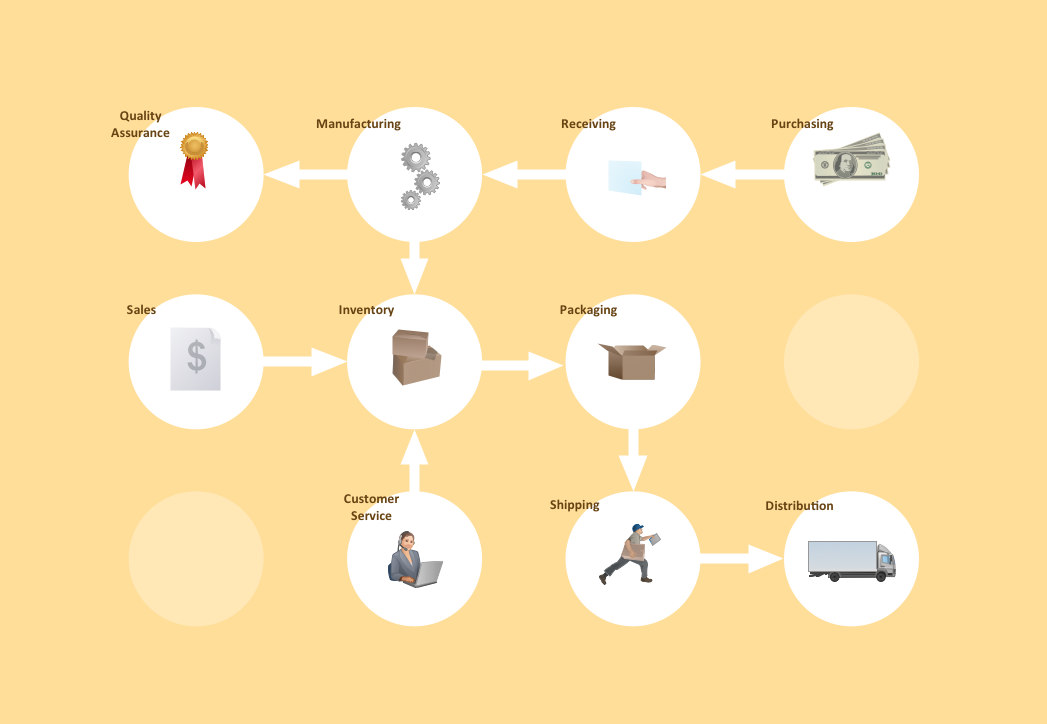
This diagram was created in ConceptDraw DIAGRAM using the "Workflow" library from the "Workflow Diagrams" solution. An experienced user spent 10 minutes creating this sample.
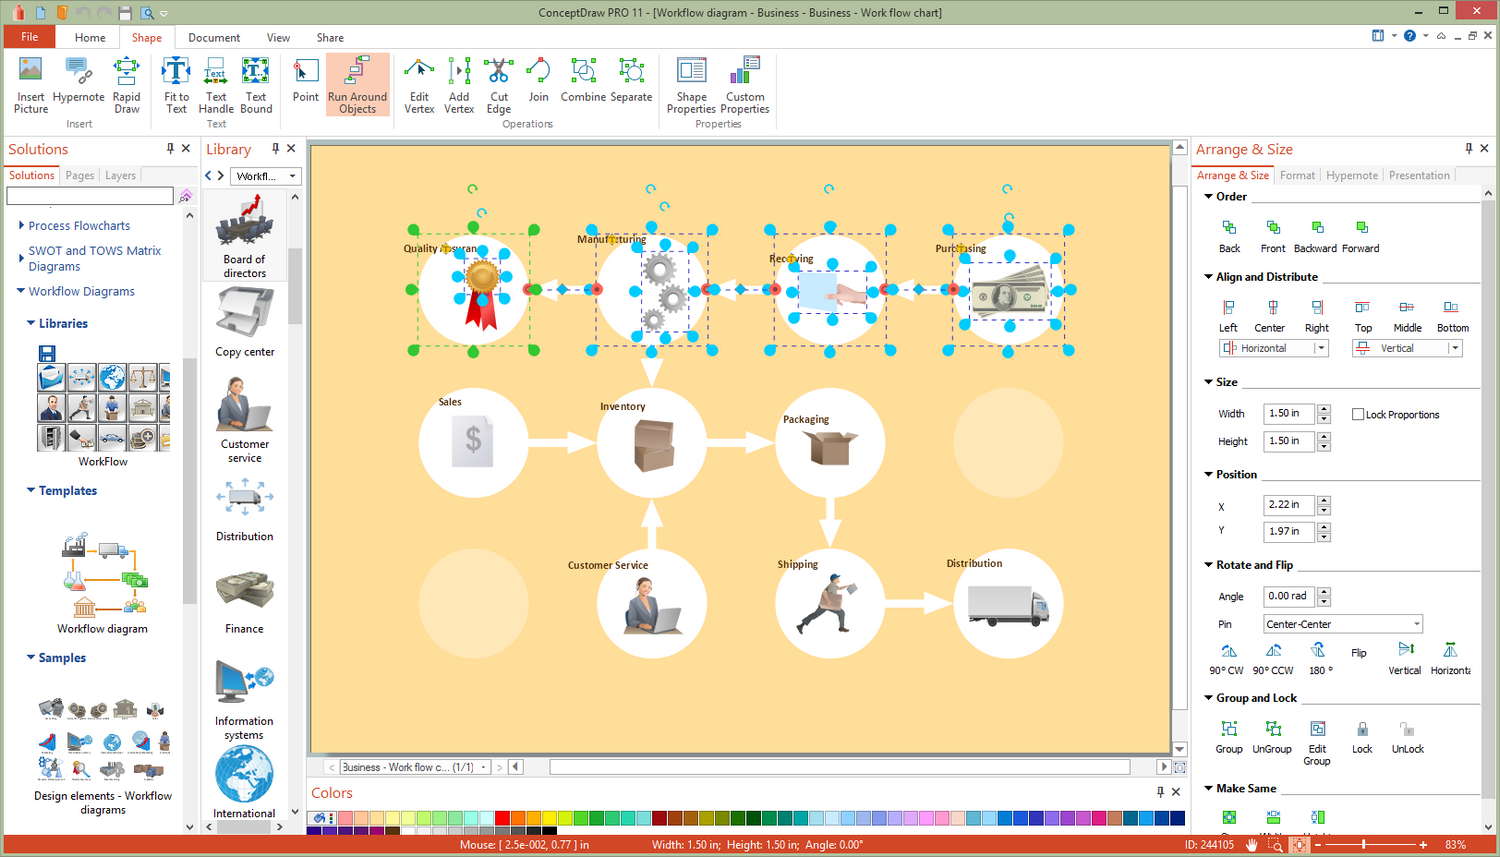
This example shows a Workflow diagram that clearly illustrates the stages from which a business consists of, relations between all parts of the business and all processes that occur in it. You can see that the workflow begins with the receiving process, then takes place the manufacturing process, the quality assurance is provided and the inventory, packaging, shipping and distribution steps are realized. The customer service and sales are also provided at the corresponding steps. Use the Workflow diagrams to automate the business processes, to represent the information flow, to realize the business process re-engineering, accounting, management, and human resources tasks in industry, business, and manufacturing, to control and to track effectively the workflow. The use of ConceptDraw DIAGRAM connectors during the process of the Work flow diagram creation is an intuitive and time-saving solution. Use the predesigned workflow vector objects and connectors from the solution's libraries to design the intuitive Workflow examples literally in a few minutes.
Example 2: Workflow Diagram — Taxi Service
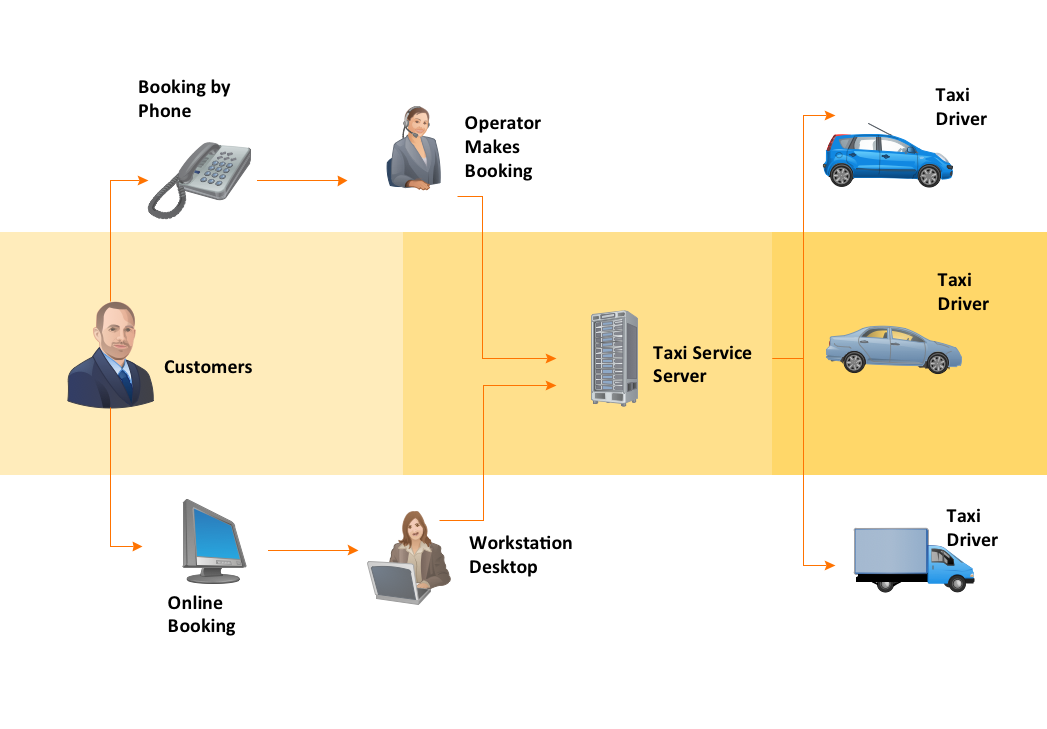
This diagram was created in ConceptDraw DIAGRAM using the "Workflow" library from the "Workflow Diagrams" solution. An experienced user spent 5 minutes creating this sample.
This Workflow diagram sample depicts a presentation-ready diagram that clearly illustrates how a taxi service works. The taxi service is a complex system, which includes a lot of interrelated processes in order to submit the car in time and to move the client from one point to another safely and without delay. It is convenient to represent the flow of these processes with a Work flow chart. Typically, the flow begins from the customer’s booking of the taxi, this can be made by phone or online in an application from some electronic device. According to the chosen method, the operator makes a booking or it is automatically received at a workstation desktop, in any way your order later proceeds to the common taxi service server, which distributes the taxi drivers between the customers and directs the cars to them. If needed, you can also add the intermediate steps such as interrelations of the taxi drivers and operators of the service server and other details.
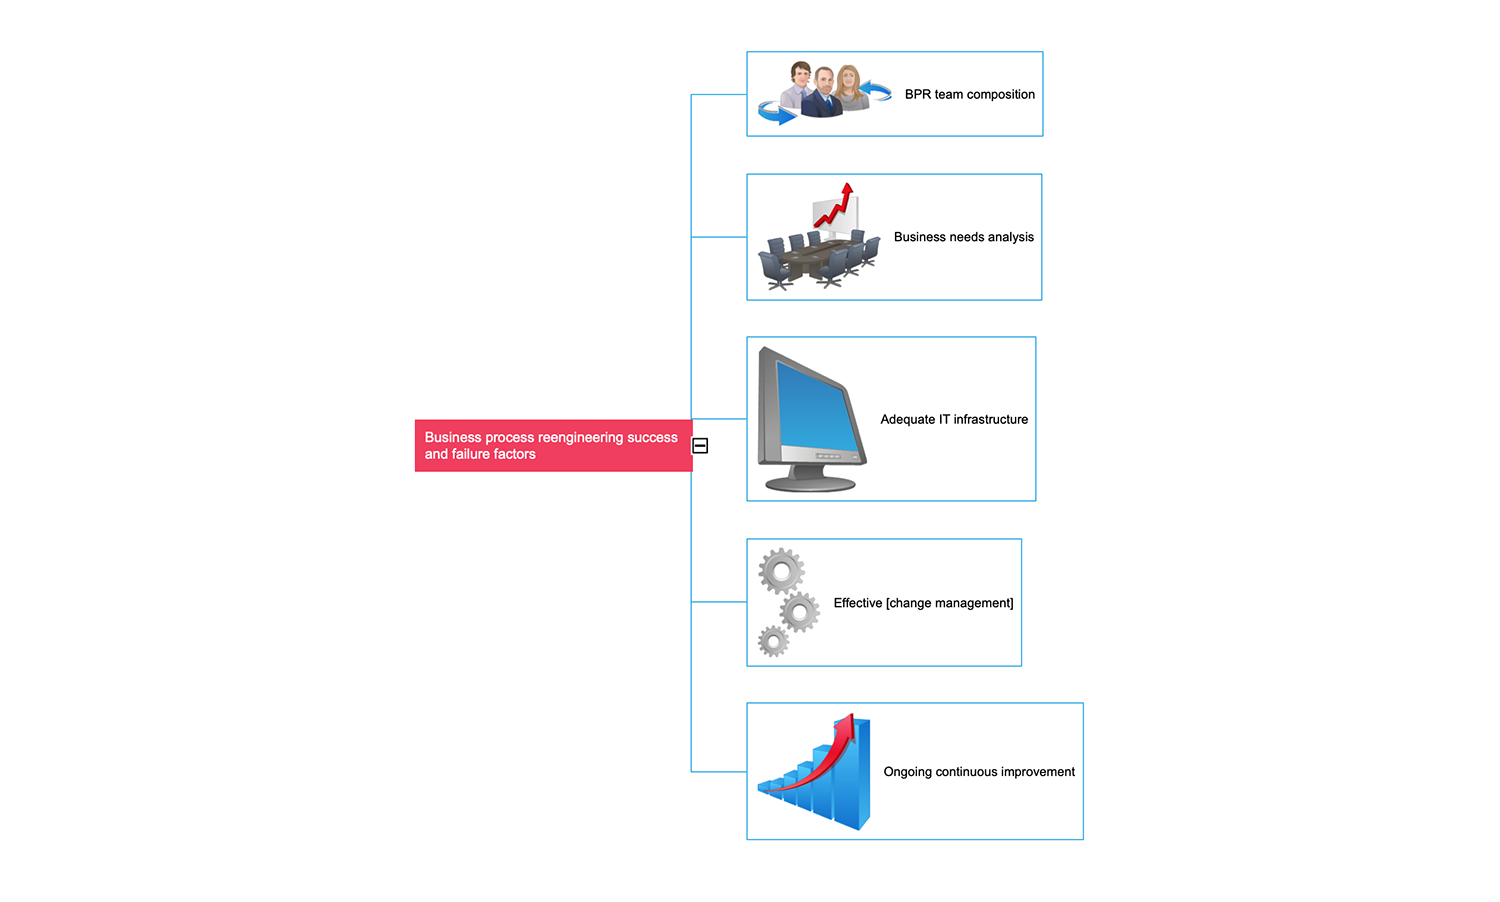
Example 3: Business Process Reengineering Success and Failure Factors
This Mind Map is dedicated to the Business Process Reengineering (BPR) success and failure factors. The BPR also known as the business process change management, business process redesign, or business transformation is a business management strategy directed to the analysis and design of business processes and workflows within an organization. The main purpose of BPR is restructuring organization's work, holistic approach to its business goals, improving the customer service, reduction the operational costs, profit optimization, productivity enhancement, and ability to become a worthy competitor on the market. In conditions of the active business processes, intense competition, high market dynamics, and constant changes of priorities in the business environment, there were summarized the following factors of Business Process Reengineering: BPR team composition, business needs analysis, adequate IT infrastructure, effective change management, ongoing continuous improvement. The form of a Mind Map is perfect for discussing the problems, listing the key points or the main factors, and quickly finding solutions.
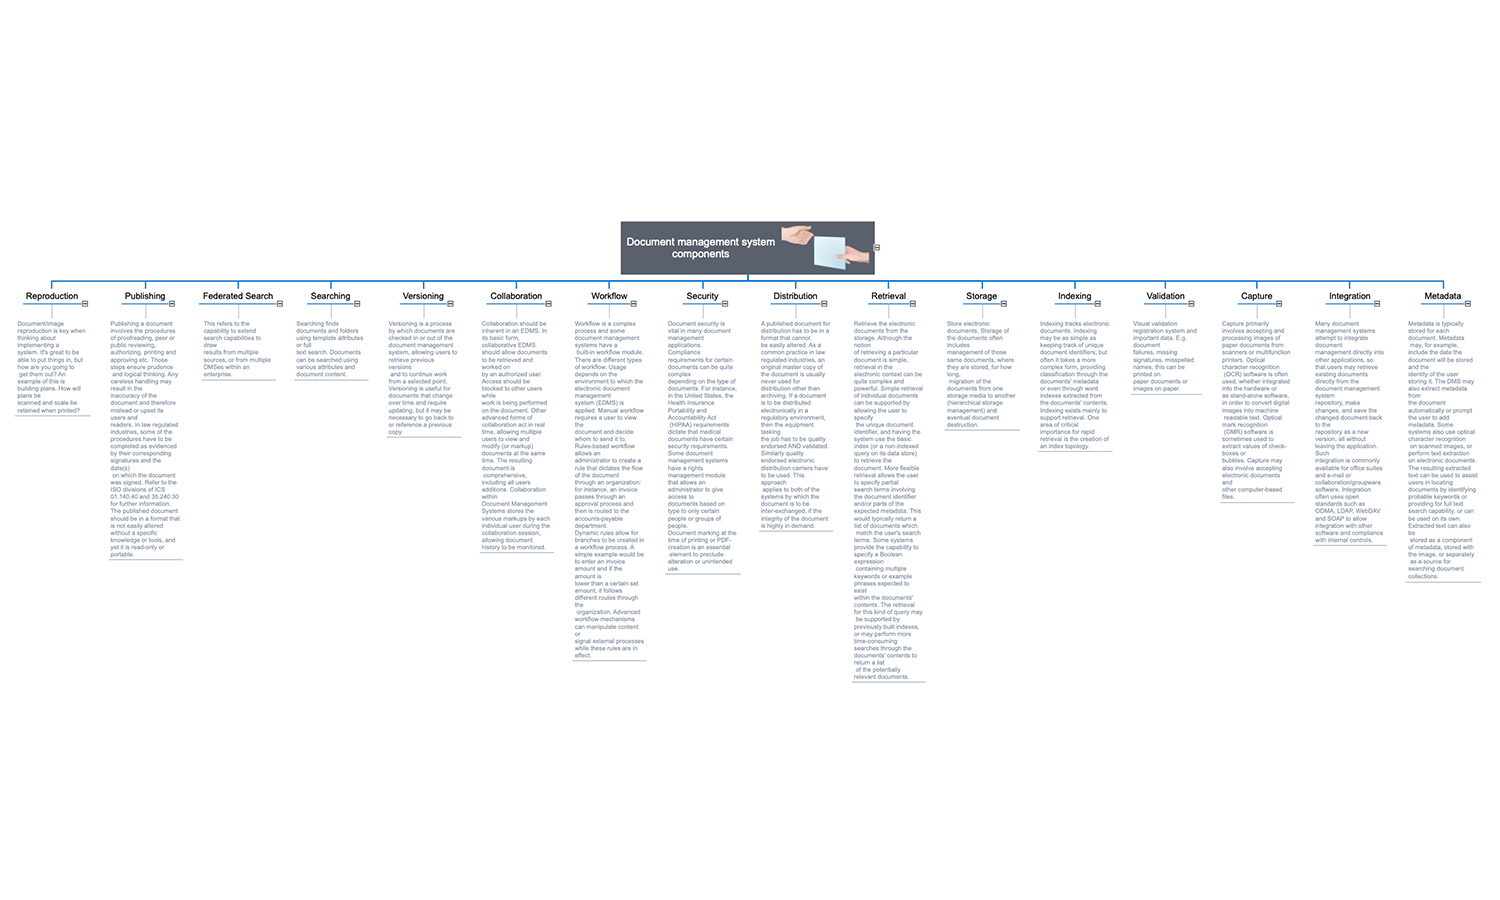
Example 4: Document Management System Components
This Mind Map demonstrates the components of the Document Management System (DMS) that is a computer system or a set of computer programs used to store the electronic versions of paper documents or only electronic documents with a goal to reduce paper, allowing tracking and managing the stored documents, ensuring their security, indexing and extensive searching capabilities. Typically, the Document management system is considered as a component of the Enterprise Content Management Systems (ECMS), which in its turn provides a lot of services and includes many components, such as the reproduction, publishing, federated search, searching, versioning, collaboration, workflow, security, distribution, retrieval, storage, indexing, validation, capture, integration, metadata. All these components with their descriptions are offered on this Mind Map for reviewing by all stakeholders. This map is quite voluminous, but it perfectly fits in ConceptDraw MINDMAP document and can be resized according to your demand — enlarged or more decreased.
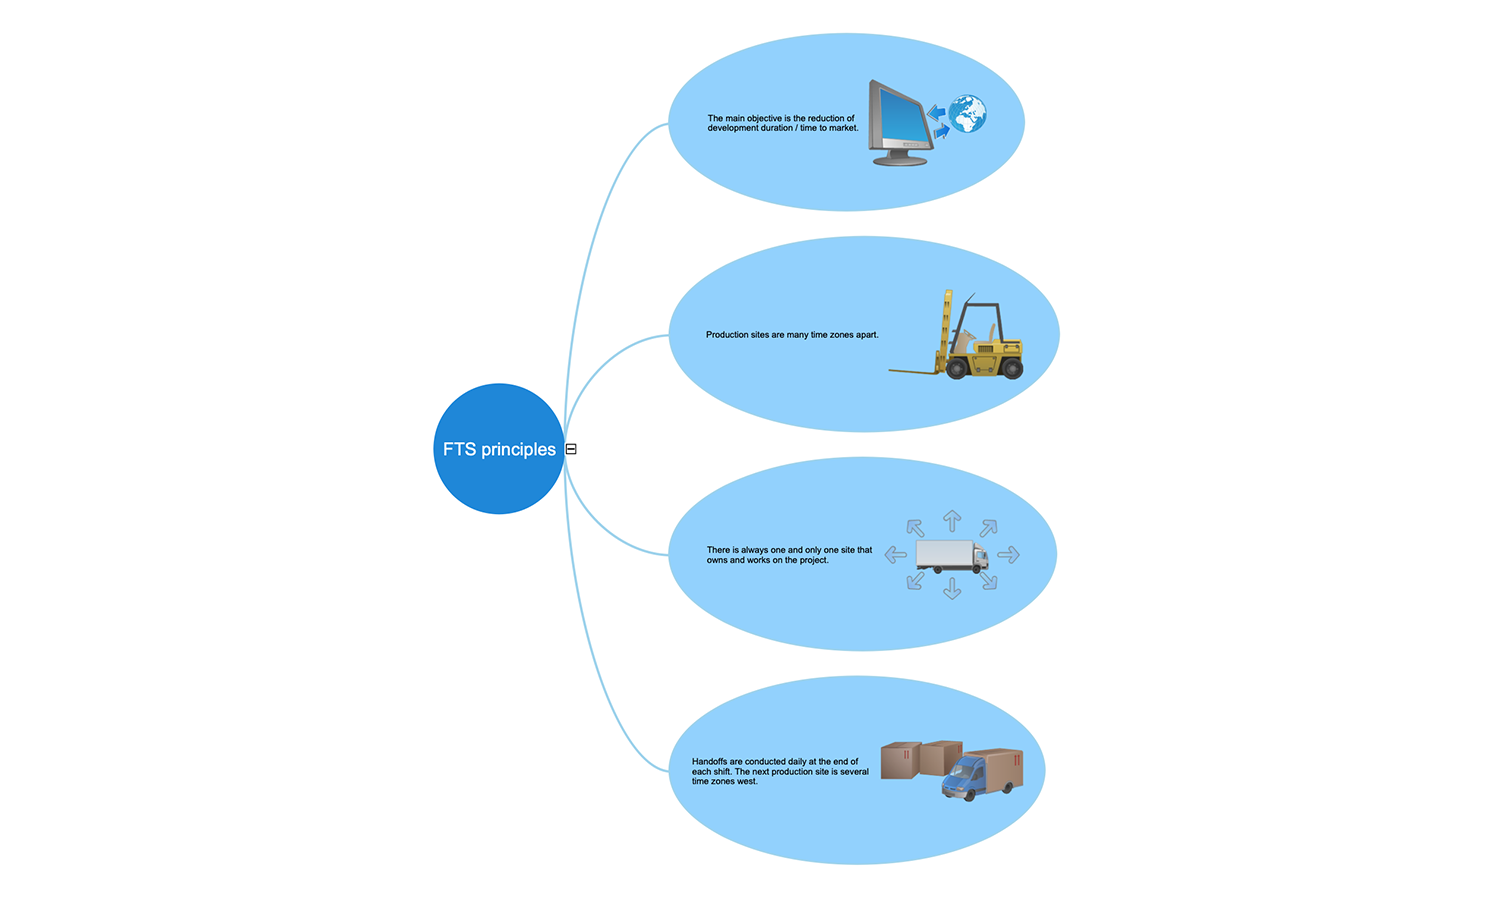
Example 5: Follow-the-Sun Principles
This Mind Map represents the principles of Follow the Sun (FTS) that is an effective way to reduce the development time of some product and so its time to market by means of significantly increasing the total development time per day. With this goal the organization of several production sites is conducted, the product is owned and developed in one timezone and at the end of their working day is handed off to the production site lying in several time zones west for further working, design and advancing. Based on this, four main principles of FTS were formulated and listed on the map: the main goal is the reduction of the time of product's development and release to the market; there is only one site that owns a certain project; the handoffs are carried out daily at the end of shift; and the most important — the production sites are in different or even opposite time zones.
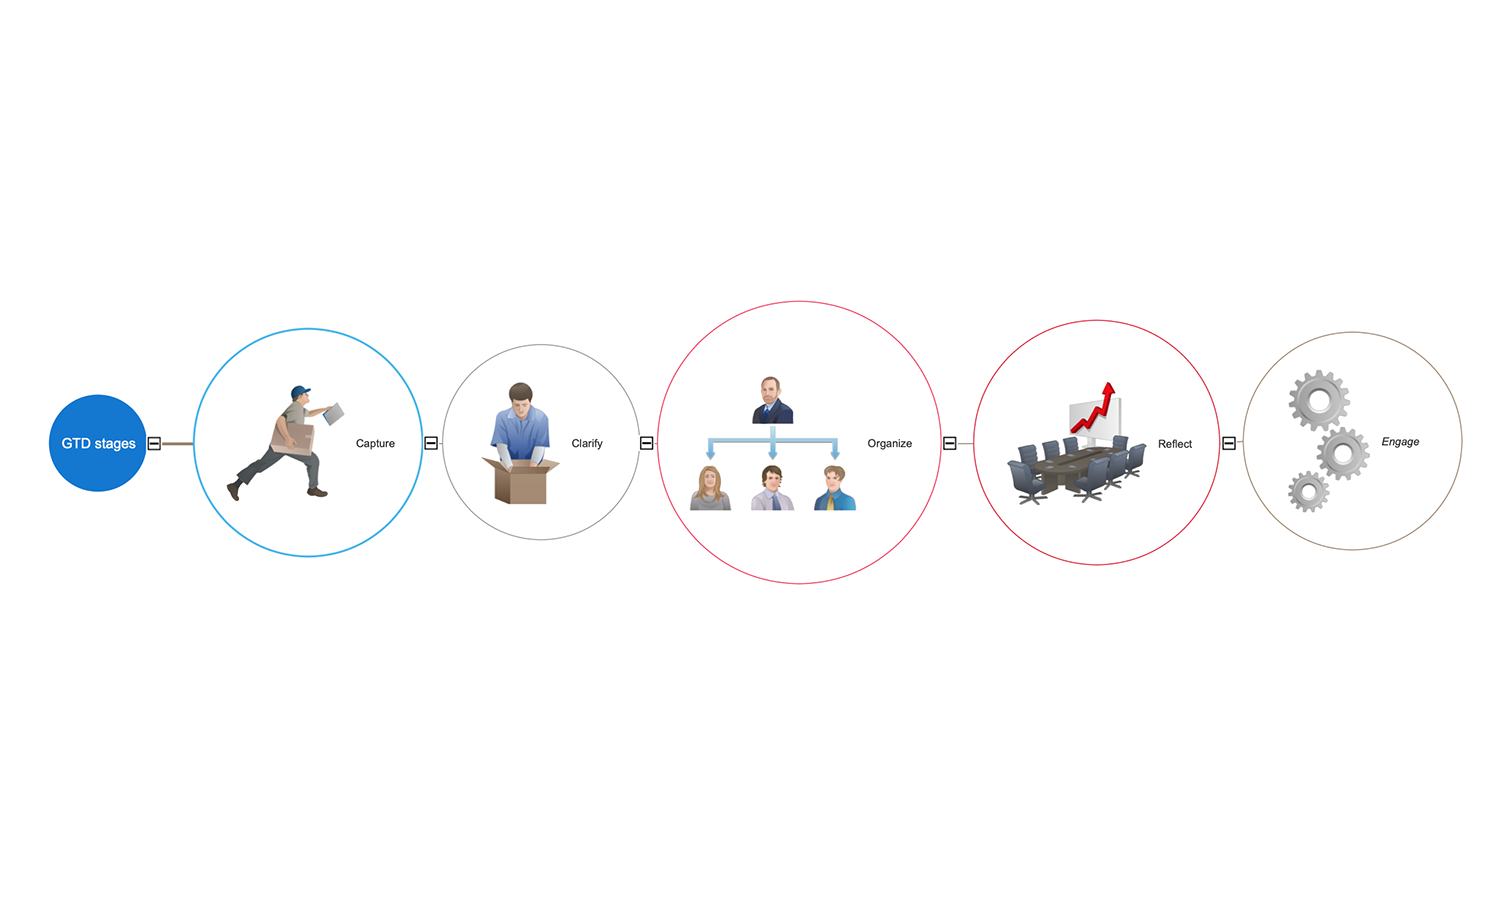
Example 6: GTD Stages
This Mind Map illustrates five stages of Getting Things Done (GTD) system developed by David Allen: capture – clarify – organize – reflect – engage. Despite their simplicity, these five steps are able to establish the order in the chaos, to increase the performance and capacity of an organization, to introduce the innovations. The Getting Things Done method is constructed on the receiving, tracking, storing and retrieving the information about the things that need to be done. The GTD relies on the use of reminders stored in a trusted system external to your mind. Such external support ensures the delivering of right reminders at the proper time that makes possible decreasing stress and increasing productivity. The planned tasks and projects are moved out of the mind to an external system, are broken into actionable work subtasks and workflows, and then are applied in the right moment. Discuss the innovative technologies, business methods and practices, brainstorm effectively your thoughts with ConceptDraw MINDMAP.
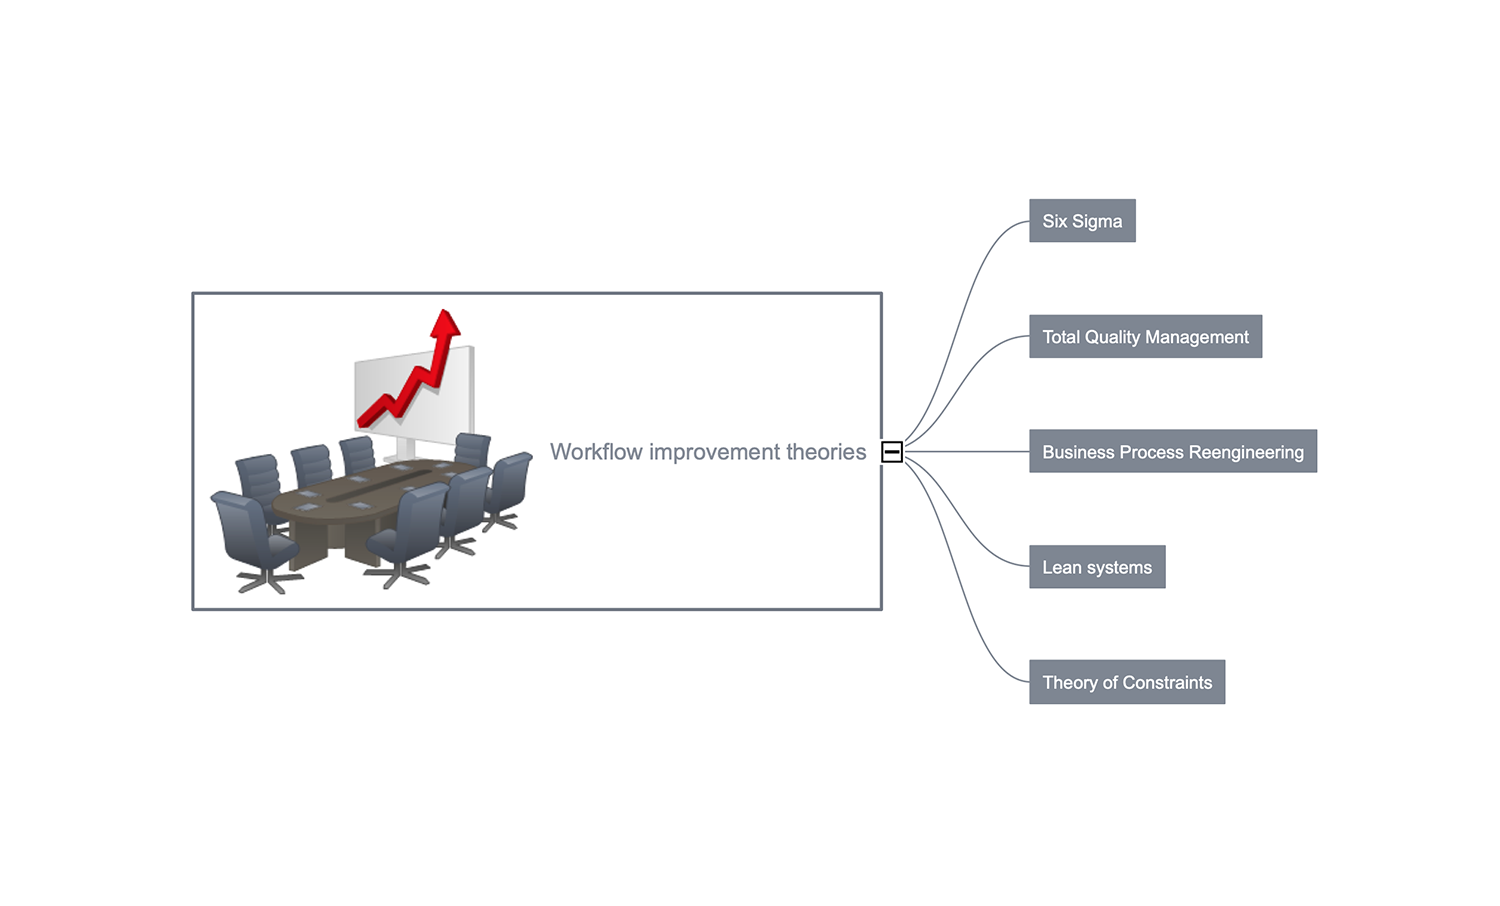
Example 7: Workflow Improvement Theories
This Mind Map sample is dedicated to the workflow improvement theories: Six Sigma, Total Quality Management, Business Process Reengineering, Lean Systems, Theory of Constraints. The workflow is a common method of describing the business processes, of representing the task flow in a process and subprocesses associated with it. The improving of the business processes is a set of methods and approaches that gives managers and enterprises' administration the opportunity to improve the efficiency of the work, to enhance the production processes, to look for opportunities of perfecting production and working conditions, to increase the efficiency of operations and the success on the market, and thus to enhance the enterprise's profits. The represented theories are actively and effectively implemented on modern enterprises, they help increase production efficiency and the enterprise's potential. At your desire, you can add more information about these theories, their detailed descriptions on this map near the corresponding topics.
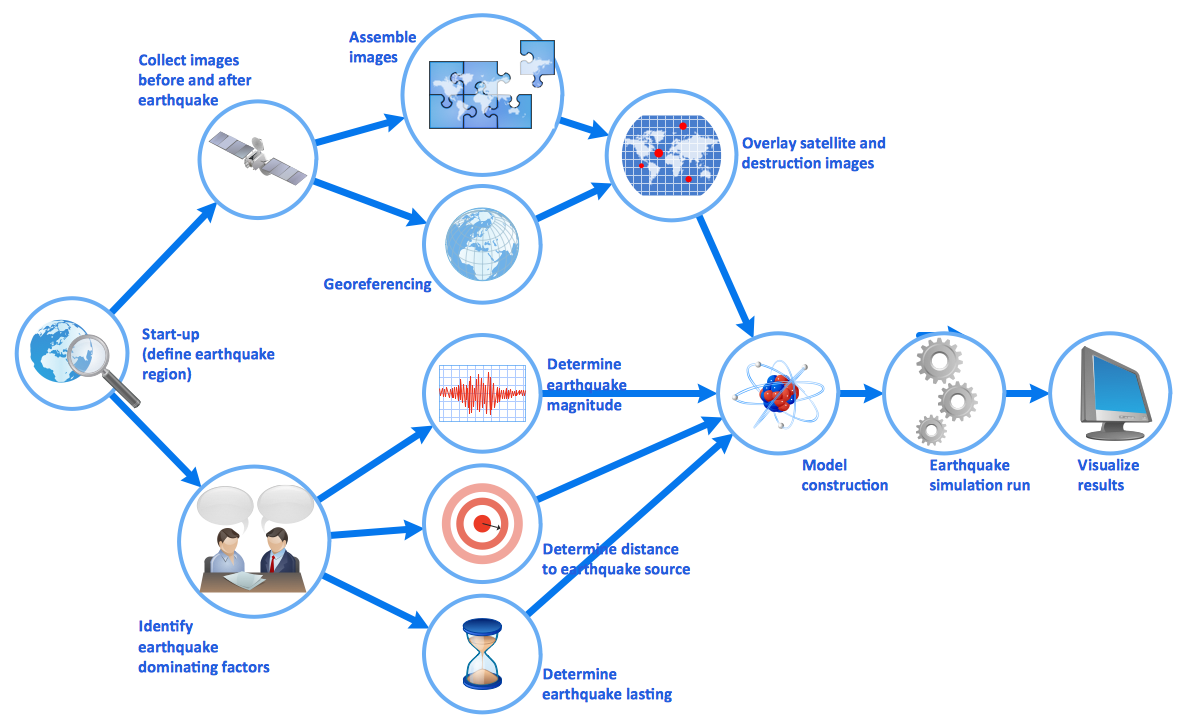
Example 8: Earthquake Disaster Assessment
This diagram was created in ConceptDraw DIAGRAM using the "Workflow" library from the "Workflow Diagrams" solution. An experienced user spent 5 minutes creating this sample.
This Workflow chart sample is made on the base of the illustration "Simulation for earthquake disaster assessment" from the article "Simulation Workflows". This simulation was developed with a goal to demonstrate and to explain all depth of the destructions and importance of the decisions to be made in various phases of crisis management. The process starts with the definition of an earthquake region, then the images before and after the earthquake are collected, and earthquake dominating factors are identified. All images including the satellite images are assembled and georeferenced, the earthquake magnitude, the distance to earthquake source and the earthquake lasting are determined, as well as the overlay of satellite and destruction images is realized. At last, the mathematical model is constructed for the different parameters (earthquake strength, time elapses, etc.), the earthquake simulation is run, and results are visualized. It is a quite complex process, but in the diagram, it is whole as at a glance.
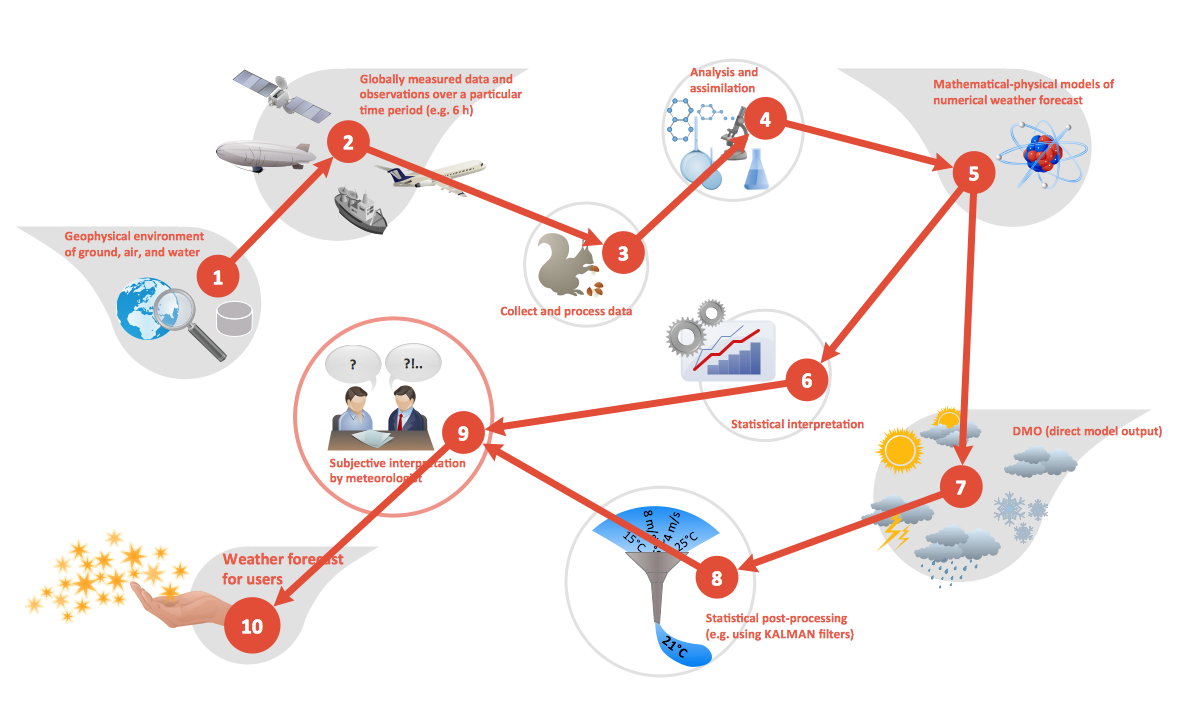
Example 9: Weather Forecast
This diagram was created in ConceptDraw DIAGRAM using the "Workflow" library from the "Workflow Diagrams" solution. An experienced user spent 5 minutes creating this sample.
This Workflow diagram sample was made on the base of the picture "Weather Forecast" from the article "Simulation Workflows" and illustrates the weather forecast. Typically, the weather is predicted for a specific geological area. The diagram depicts 10 steps composing this process. It is started with modeling the geophysical environment of ground, air, and water for a specific area. The different variables are globally measured (air and water temperature, wind velocity, air pressure and humidity, cloud velocity, rainfall, etc.) and observed over a specified period of time, for example, 6 hours. The data are collected from the different sources, processed, analyzed and assimilated, the mathematical-physical model of a numerical weather forecast is made and statistical interpretation is added. It is also realized the numerical post-processing with the DMO (direct model output) and the failures of measuring devices are removed using the KALMAN filters. At last, the subjective interpretation is realized by meteorologists and then the ready weather forecast is visualized and presented for users.
Inside
What I Need to Get Started
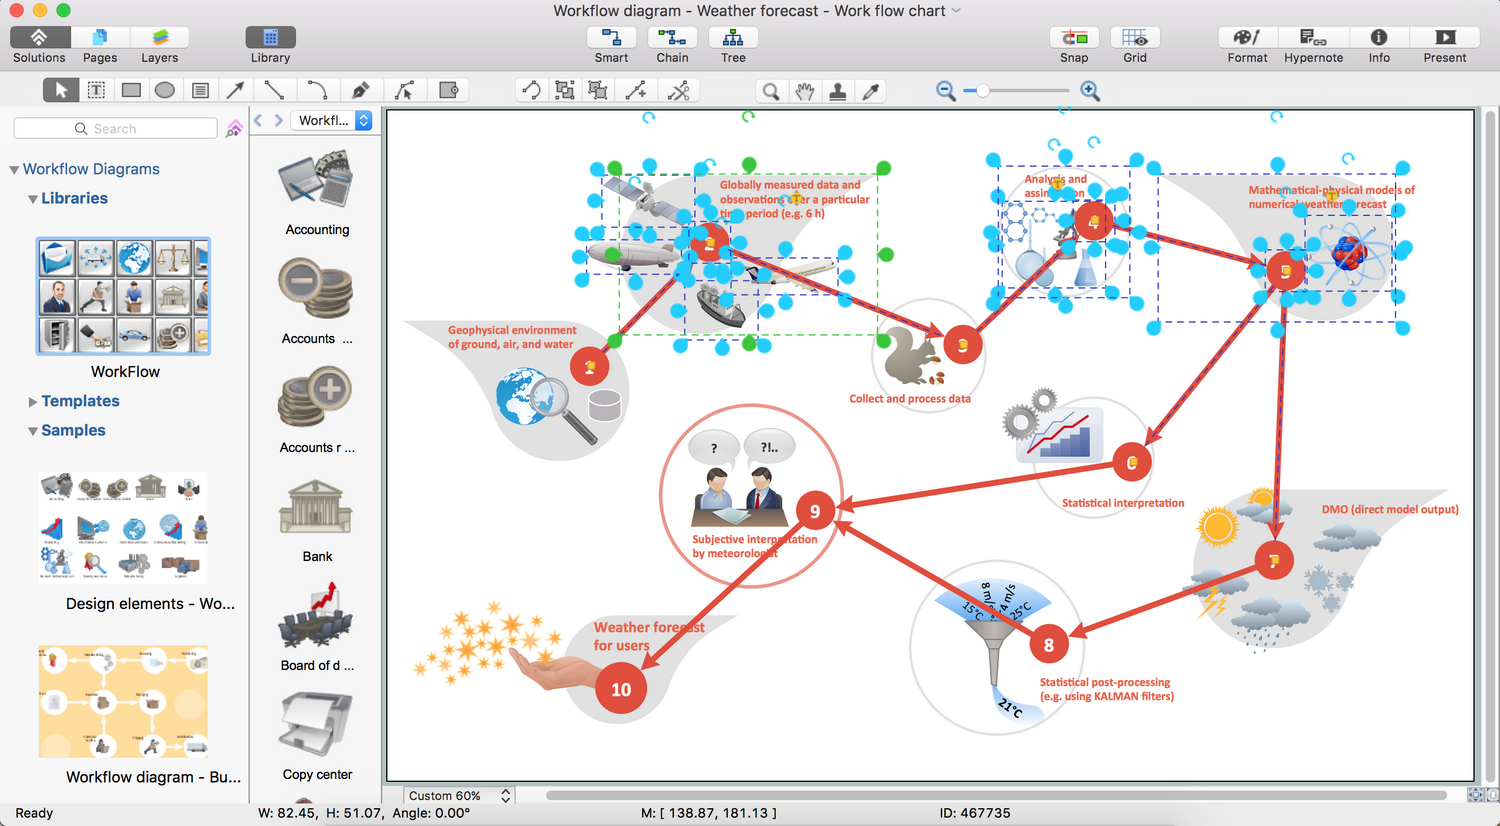
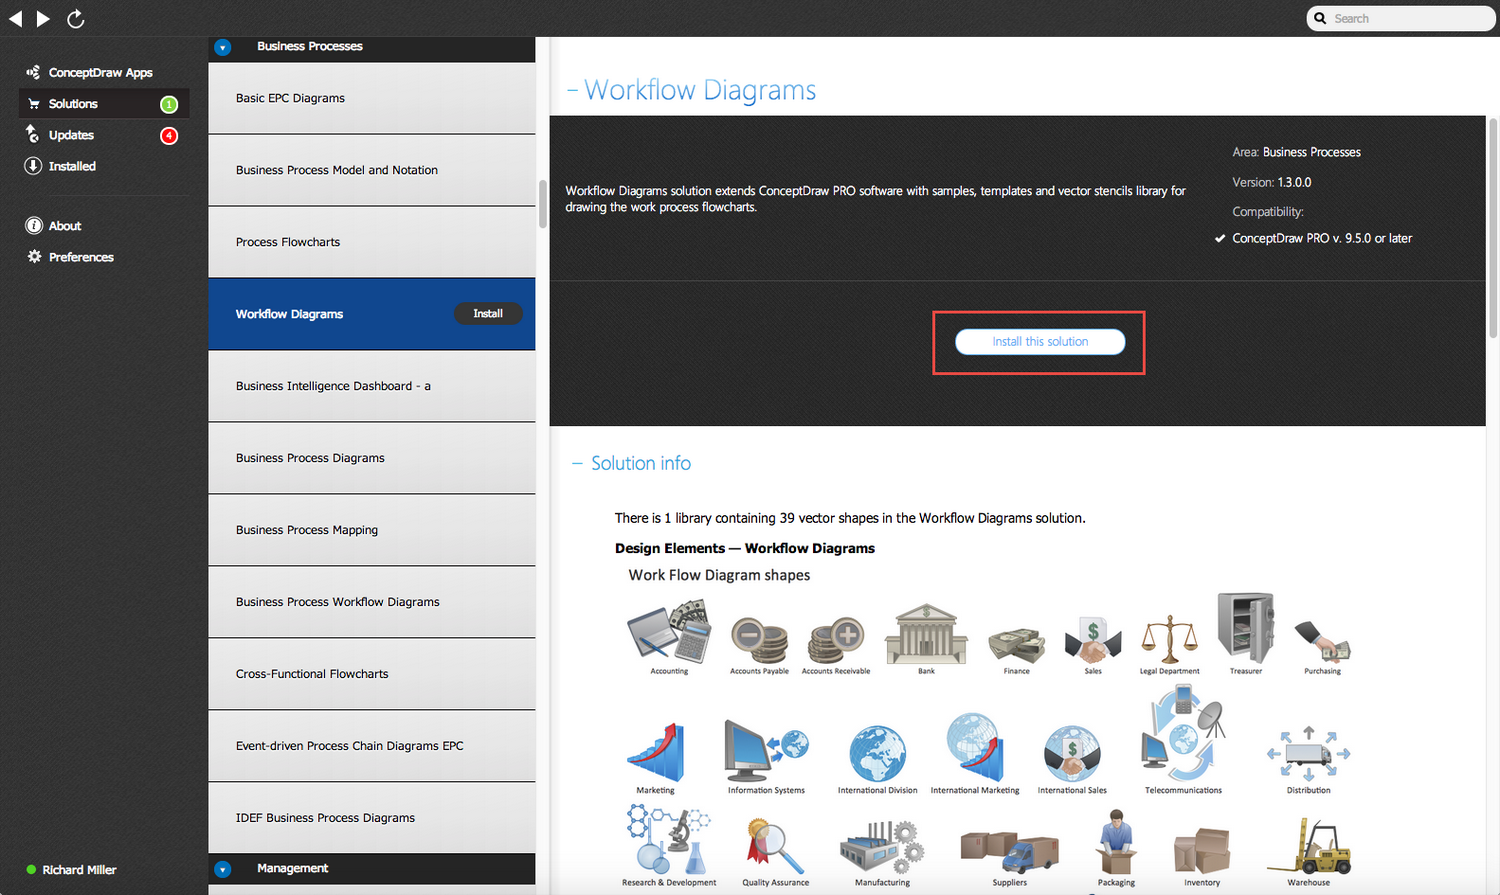
Both ConceptDraw DIAGRAM diagramming and drawing software and the Workflow Diagrams solution can help creating the business processes diagrams you need. The Workflow Diagrams solution can be found in the Business Processes area of ConceptDraw STORE application that can be downloaded from this site. Make sure that both ConceptDraw DIAGRAM and ConceptDraw STORE applications are installed on your computer before you get started.
How to install
After ConceptDraw STORE and ConceptDraw DIAGRAM are downloaded and installed, you can install the Workflow Diagrams solution from the ConceptDraw STORE.
Start using
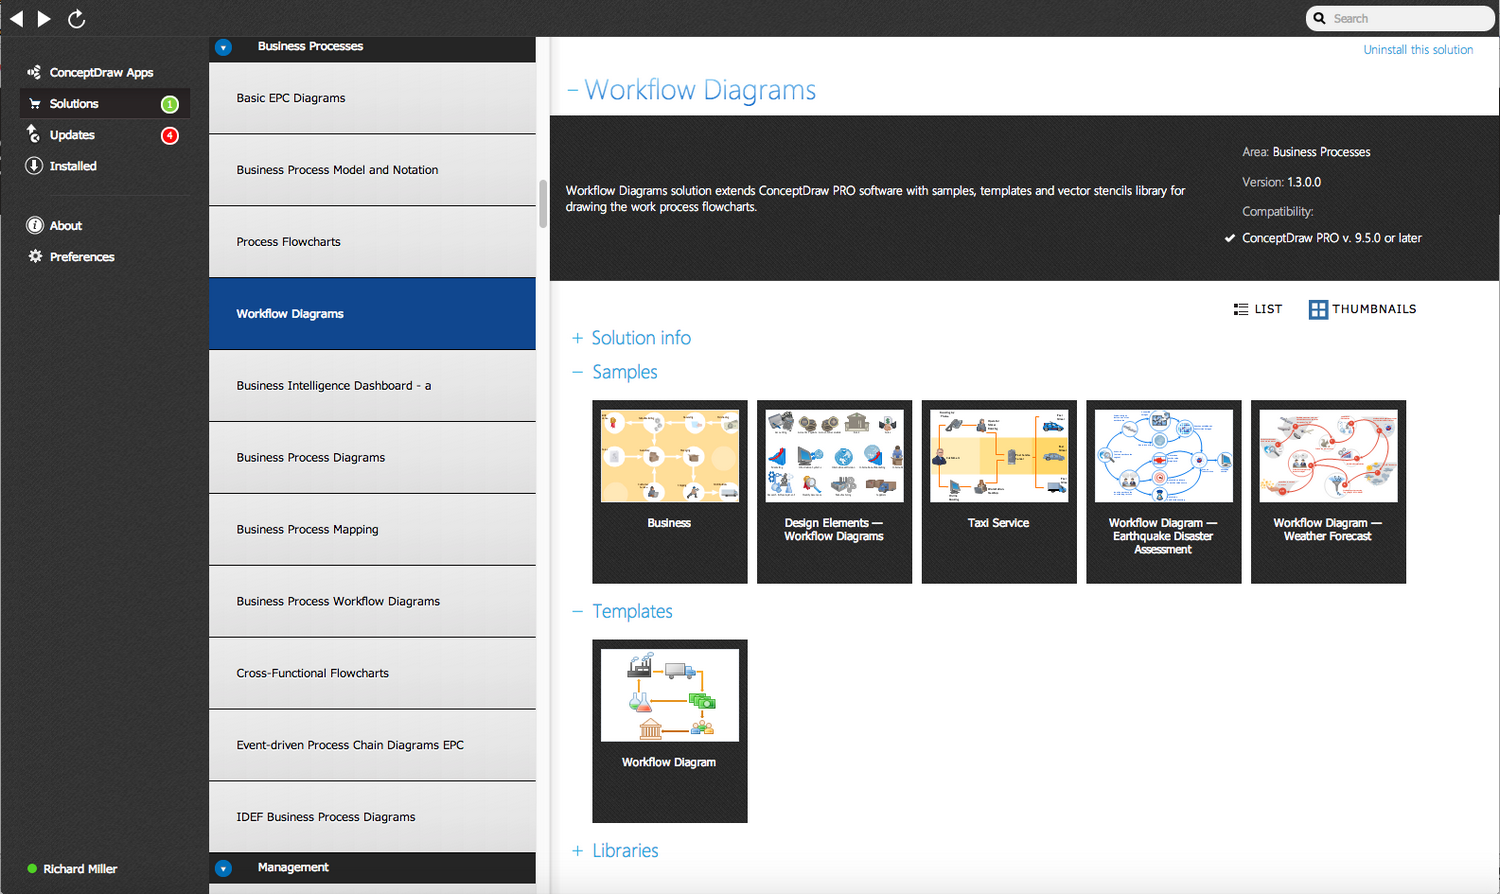
To make sure that you are doing it all right, use the pre-designed symbols from the stencil libraries from the solution to make your drawings look smart and professional. Also, the pre-made examples from this solution can be used as drafts so your own drawings can be based on them. Using the samples, you can always change their structures, colors and data.
Workflow Diagrams
When you distil a particular business activity into a set of linear, repeatable actions, you can call this self contained process a workflow. It is a broad term that can describe the transformation of materials through production, services provided to a customer base, the journey of information through a system, or the internal behavior of employees within a company. They can represent abstract concepts or development phases of a system, as well as real-time processes such as manufacturing and distribution.
The idea of a workflow sprang from manufacturing industries in the early 20th century, when research was made into the connection between the steps needed to complete a task, and the resulting output — essentially an early study of business efficiency. Later, with the introduction of the typewriter and copier, this same theory was transplanted to the office environment, where new systems for physical data storage and filing were needed to be expressed. Eventually even more complex workflows would arrive with the advent of computer technology, with its vast array of options for system architecture, and the availability of almost limitless storage for virtual data.
It was quickly learnt that the most effective method of analyzing and sharing workflow information was through a visual medium, using specific diagramming techniques to condense what could be a complex and time consuming process onto a single reference page. Although the visual style of any one diagram can vary greatly, they will commonly show a process as a set of steps, using iconography to depict inputs (data, resources, or materials), describing any transformations or decisions that need to be made, and similar illustrations for any process outputs or customer interaction.

A workflow diagram created using ConceptDraw DIAGRAM, showing a high level process involving many departments
The advantages these workflow diagrams offered to a company and its employees were numerous, and remain relevant to this day in all forms of business:
- They define employee roles and responsibilities.
- They allow for strategy optimization and efficiency by identifying bottlenecks, redundant steps, or problem departments.
- Further to above, you can analyze a process as a whole, or focus on one of its constituent parts.
- Ideas can be communicated between team members more effectively — visual communication takes away the need for in-depth knowledge of a subject
- Visualization also facilitates understanding for a multi-national workforce.
- Provides a complete summation of all resources, data, or materials necessary to the process.
- Workflow diagrams can show a process at each stage of development, from planning through to implementation.
Modern workflow diagrams have a specific focus on quality control. This can apply to the quality of inputs and outputs inherent to a process, or to the actual efficiency of the workflow itself. Different sectors of business will use different diagramming techniques, and this has given rise to a number of methodologies that have become recognized in their own right as industry standards.
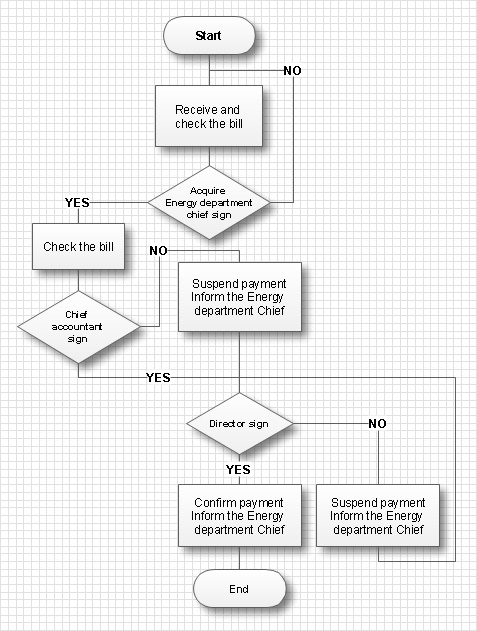
Flowcharts are a common way of describing a simple workflow — this one was created using solutions from ConceptDraw DIAGRAM
Here are some of examples of the most common methodologies that have been developed and employed by many forms of business:
- Six Sigma — a set techniques and tools for process improvement that was developed by engineers at the firm Motorola. In this environment, a sigma rating describes how free of defects a products is, with six being the optimum rating. The core principles of this methodology identify the root causes of defects, and work to minimize variability in repeatable manufacturing and business processes.
- Theory of Constraint — works from the idiom that states 'a chain is no stronger than its weakest link'. Workflow diagrams created using this method attempt to isolate parts of a process that may contribute to adverse results — these are termed as 'constraints'. By design, there is always at least one constraint; it can be anything from a specific employee to a certain policy that hinders production.
- Lean production — systematically works to reduce waste from the manufacturing process, using diagrams to highlight instances of overburden or unevenness in workflows that lead to inefficient practices.
- Total Quality Management — looks at quality from the customers point of view, by determining what changes to a process, if any, can give greater value to the customer. Management process are a key focus, with the belief that correcting workflows at the top of hierarchy will lead to better practices filtering down through the workforce.
When it comes to creating a workflow diagram, it's important to use software that is capable of describing a wide range of processes, using techniques and graphical notation that are easily recognized by knowledge workers in all forms of business. An ideal drawing platform will utilize functions that can cope with the output of a high volume of processes, that may change rapidly from development to implementation stages.
ConceptDraw DIAGRAM, with the extended functionality of the Workflow Diagrams solution, is the ideal medium for creating designs of this type. Its RapidDraw technology takes the strain from diagram arrangement, allowing users to create their process steps with a single click, ideal for generating the many repeatable tasks that can make up a workflow. The Workflow Diagrams solution complements this feature with a library of selected icons to represent various steps — all instantly recognizable and applicable to a wide user base.

A selection of icons available in the Workflow Diagrams solution for ConceptDraw DIAGRAM
Included also with the solution are a number of templates and samples, giving the user a base from which to explore ConceptDraw DIAGRAM 's powerful diagramming tools, helping to save time along the way. Diagramming a workflow to assess quality control and management requires quality software — ConceptDraw DIAGRAM with the Workflow Diagrams solution is the best option to guide you through the process.