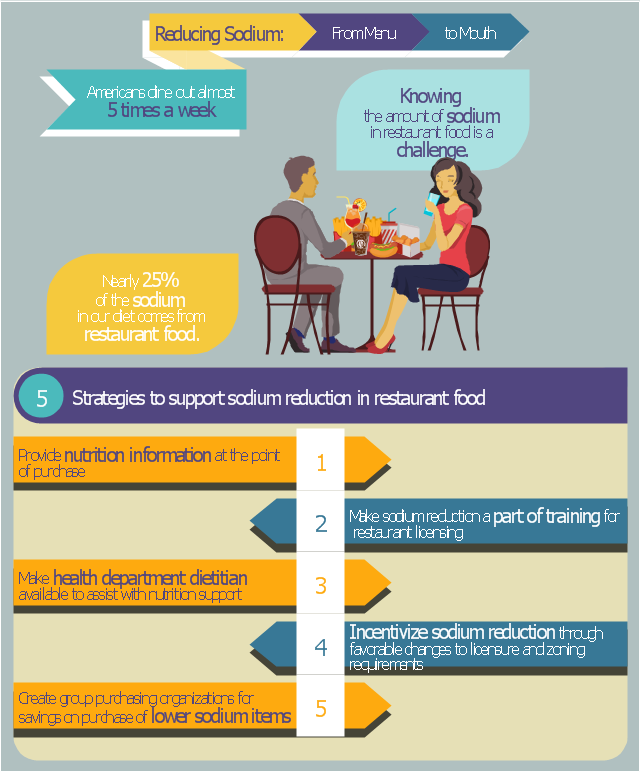
This human nutrition infographic example is redesigned from the Reducing Sodium: From Menu to Mouth Infographic on the Centers for Disease Control and Prevention (CDC) website.
"Infographics (Information Graphics) are visual representations of data, information or knowledge that tell a story through visual communication. ... infographics related to sodium and sodium reduction."
[cdc.gov/ salt/ sodium_ infographics.htm]
"The average American eats out at a fast food or dine-in restaurant almost five times a week. CDC is collaborating with the food industry to reduce sodium in the food supply and providing technical assistance to the public health community for work on sodium reduction, as it is a public health priority. CDC is offering strategies for how health departments and restaurants can work together for sodium reduction and to provide consumers with healthier choices in the report “From Menu to Mouth: Opportunities for Sodium Reduction in Restaurants,” published ... in CDC’s journal, Preventing Chronic Disease." [cdc.gov/ media/ dpk/ 2014/ dpk-sodium-content.html]
The diet infographics example "Food infogram - Reducing sodium" was drawn using the ConceptDraw PRO diagramming and vector drawing software extended with the Food Court solution from the Food and Beverages area of ConceptDraw Solution Park.
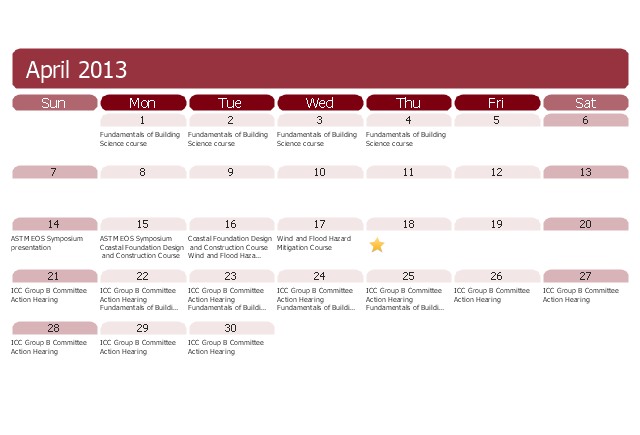
This activities calendar sample was created on the base of figure from the Federal Emergency Management Agency (FEMA) website. [fema.gov/ sites/ default/ files/ images/ 2013_ bld_ sci_ activities_ calendar_ 4-13.jpg]
"The FEMA Building Science Branch provides technical services for the Federal Insurance and Mitigation Administration (FIMA). The branch develops and produces multi-hazard mitigation guidance that focuses on creating disaster-resilient communities to reduce loss of life and property. Building Science Branch activities include deploying Mitigation Assessment Teams to conduct post-disaster engineering investigations for both man-made and natural hazard events. Building Science takes a lead role in developing publications, guidance materials, tools, technical bulletins and recovery advisories that incorporate the most up-to-date building codes, floodproofing requirements, seismic design standards and wind design requirements for new construction and the repair of existing buildings. ... Building Science Branch provides technical support for the National Flood Insurance Program (NFIP) for public and private sector stakeholders, the National Earthquake Hazards Reduction Program (NEHRP), the National Windstorm Impact Reduction Program (NWIRP) and pursuing outreach strategies for communicating building science issues." [fema.gov/ building-science]
The activities calendar example "FEMA Building Science Branch" was created using the ConceptDraw PRO diagramming and vector drawing software extended with the Calendars solution from the Management area of ConceptDraw Solution Park.
The vector stencils library "Audio" contains 91 audio, sound and music icons. Use it to design your audio, video and multimedia illustrations, presentations, web pages and infographics with ConceptDraw PRO diagramming and vector drawing software.
"Digital audio refers to technology that can be used to record, store, generate, manipulate, and reproduce sound using audio signals encoded in digital form. Following significant advances in digital audio technology during the 1970s, it rapidly replaced analog audio technology in most areas of sound production, sound engineering and telecommunications. Sound is converted to an analog electrical signal by a microphone, then an analog-to-digital converter (ADC), typically using pulse-code modulation, is used to convert it to a digital signal. A digital-to-analog converter performs the reverse process, converting a digital signal back into an analog signal, which can be converted to an audible sound by a loudspeaker. Digital audio systems may include compression, storage, processing and transmission components. Conversion to a digital format allows convenient manipulation, storage, transmission and retrieval of an audio signal." [Digital audio. Wikipedia]
The vector stencils library "Audio" is included in the Audio, Video, Media solution from the Illustration area of ConceptDraw Solution Park.
Business Process Optimization
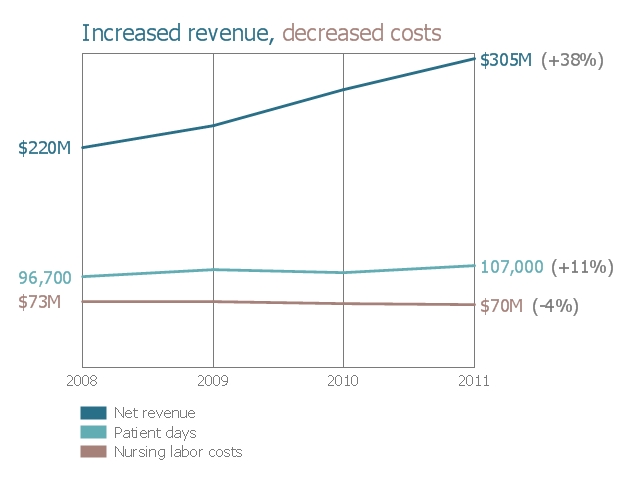
Business process optimization is one of the most important components of the business process management which helps increase the effectiveness of organization work. ConceptDraw PRO diagramming and vector drawing software extended with Business Process Workflow Diagrams solution from the Business Processes area of ConceptDraw Solution Park ideally suits for effective business process optimization, for determination the opportunities for improvements and enhancements the processes, cost reduction and cost savings.This example was drawn on the base of chart from the webpage "Run your nursing department like a business" on the website of the University of Utah Health Care. "With centralized, global staffing and smaller, flexible nursing pods on each unit, University of Utah Health Care has a healthier financial outlook than ever before, taking care of 11% more patients with 4% less labor—a reduction in nursing labor costs of $100 per patient day."
[healthcare.utah.edu/ nursinginnovation/ 2011/ 10ideas/ one.php]
"A run chart, also known as a run-sequence plot is a graph that displays observed data in a time sequence. Often, the data displayed represent some aspect of the output or performance of a manufacturing or other business process." [Run chart. Wikipedia]
The run chart is one of the Seven Basic Tools of Quality. [Seven Basic Tools of Quality. Wikipedia]
The run chart example "Nursing department finance" was created using the ConceptDraw PRO software extended with the Seven Basic Tools of Quality solution from the Quality area of ConceptDraw Solution Park.
"As a discipline, task management embraces several key activities. Various conceptual breakdowns exist, and these, at a high-level, always include creative, functional, project, performance and service activities.
Creative activities pertain to task creation. In context, these should allow for task planning, brainstorming, creation, elaboration, clarification, organization, reduction, targeting and preliminary prioritization.
Functional activities pertain to personnel, sales, quality or other management areas, for the ultimate purpose of ensuring production of final goods and services for delivery to customers. In context these should allow for planning, reporting, tracking, prioritizing, configuring, delegating, and managing of tasks.
Project activities pertain to planning and time and costs reporting. These can encompass multiple functional activities but are always greater and more purposeful than the sum of its parts. In context project activities should allow for project task breakdown, task allocation, inventory across projects, and concurrent access to task databases.
Service activities pertain to client and internal company services provision, including customer relationship management and knowledge management. In context these should allow for file attachment and links to tasks, document management, access rights management, inventory of client & employee records, orders & calls management, and annotating tasks.
Performance activities pertain to tracking performance and fulfillment of assigned tasks. In context these should allow for tracking by time, cost control, stakeholders and priority; charts, exportable reports, status updates, deadline adjustments, and activity logging.
Report activities pertain to the presentation of information regarding the other five activities listed, including graphical display." [Task management. Wikipedia]
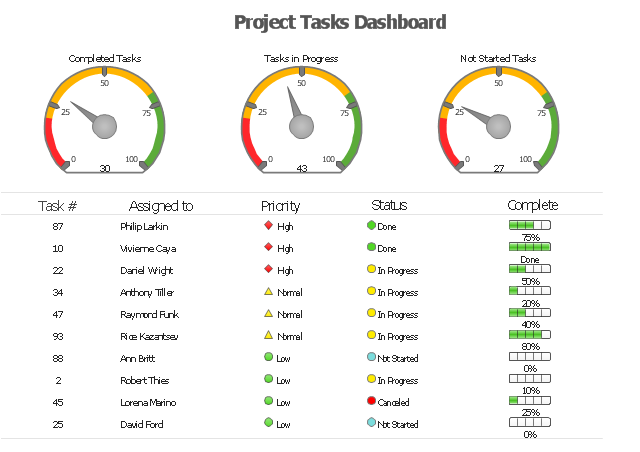
The example "Project tasks dashboard" was created using the ConceptDraw PRO diagramming and vector drawing software extended with the Status Dashboard solution from the area "What is a Dashboard" of ConceptDraw Solution Park.
Chemistry Drawings
ConceptDraw PRO diagramming and vector drawing software extended with Chemistry solution from the Science and Education area is a powerful chemistry drawing software that is ideal for quick and easy designing of various: chemistry drawings, scientific and educational chemistry illustrations, schemes and diagrams of chemical and biological lab set-ups, images with chemical formulas, molecular structures, chemical reaction schemes, schemes of labware, that can be then successfully used in the field of science and education, on various conferences, and so on.Bar Diagrams for Problem Solving. Create manufacturing and economics bar charts with Bar Graphs Solution
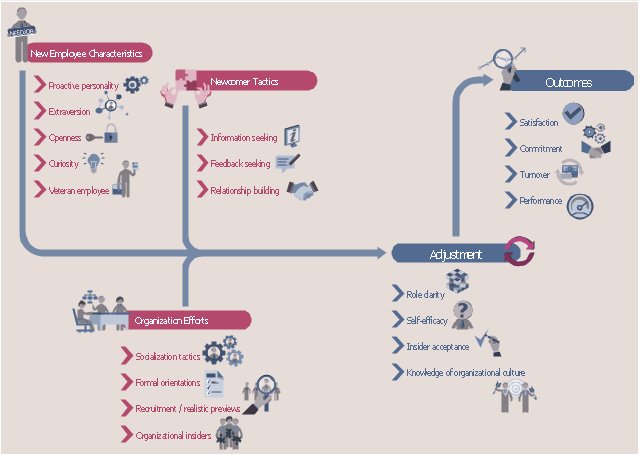
Create bar charts for visualizing problem solving in manufacturing and economics using the ConceptDraw PRO diagramming and vector drawing software extended with the Bar Graphs Solution from the Graphs and Charts area of ConceptDraw Solition Park.HR infographics "Onboarding model" was redesigned from the Wikimedia Commons file: Organizationalsocializationmodel.jpg. [commons.wikimedia.org/ wiki/ File:Organizationalsocializationmodel.jpg]
This file is licensed under the Creative Commons Attribution-Share Alike 3.0 Unported license. [creativecommons.org/ licenses/ by-sa/ 3.0/ ]
"Onboarding, also known as organizational socialization, refers to the mechanism through which new employees acquire the necessary knowledge, skills, and behaviors to become effective organizational members and insiders. Tactics used in this process include formal meetings, lectures, videos, printed materials, or computer-based orientations to introduce newcomers to their new jobs and organizations. Research has demonstrated that these socialization techniques lead to positive outcomes for new employees such as higher job satisfaction, better job performance, greater organizational commitment, and reduction in occupational stress and intent to quit. These outcomes are particularly important to an organization looking to retain a competitive advantage in an increasingly mobile and globalized workforce." [Onboarding. Wikipedia]
The HR infographics example "Onboarding model" was created using the ConceptDraw PRO diagramming and vector drawing software extended with the HR Flowcharts solution from the Management area of ConceptDraw Solution Park.
Process Flowchart Symbols
The Process Flowchart or Process Flowchart Diagram (PFD) is a visual representation relations between major parts of the system, the steps in a process, and even connections between various systems. The possibility to easy create professional-looking and attractive Process Flowcharts, Business Process Diagrams and Maps which visualize the steps of complex processes is provided by Business Process Diagram Solution from the Business Processes Area of ConceptDraw Solution Park and 16 libraries with 230 process flowchart symbols from BPMN 1.2 and BPMN 2.0.The vector stencils library "Shipping and receiving" contains 18 symbols of industrial shipping and receiving equipment.
Use the design elements library "Shipping and receiving" to draw factory warehouse equipment layout plans, floor plans of shipping and receiving centers with equipment for hauling, transporting, and distributing manufactured goods, freight, cargo, and stock from plants and industrial facilities using the ConceptDraw PRO diagramming and vector drawing software.
"Freight transport, or shipping, is a key in the value chain in manufacturing.
While all modes of transport are used for cargo transport, there is high differentiation between the nature of the cargo transport, in which mode is chosen.
Logistics refers to the entire process of transferring products from producer to consumer, including storage, transport, transshipment, warehousing, material-handling and packaging, with associated exchange of information.
Containerization, with the standardization of ISO containers on all vehicles and at all ports, has revolutionized international and domestic trade, offering huge reduction in transshipment costs. Traditionally, all cargo had to be manually loaded and unloaded into the haul of any ship or car; containerization allows for automated handling and transfer between modes, and the standardized sizes allow for gains in economy of scale in vehicle operation." [Transport. Freight.
Wikipedia]
This shapes library "Shipping and receiving" is included in the Plant Layout Plans solution from the Building Plans area of ConceptDraw Solution Park.
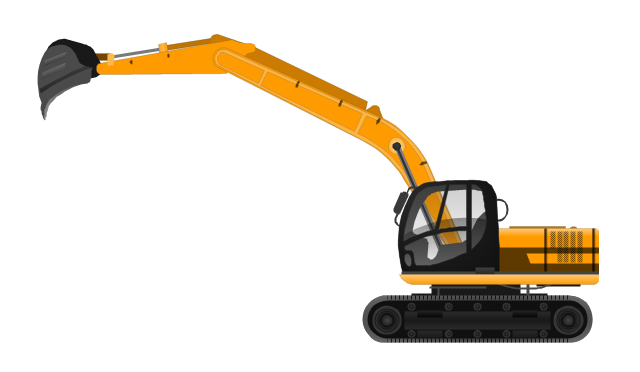
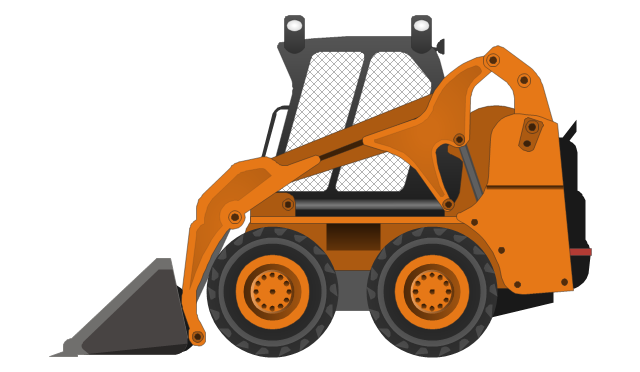
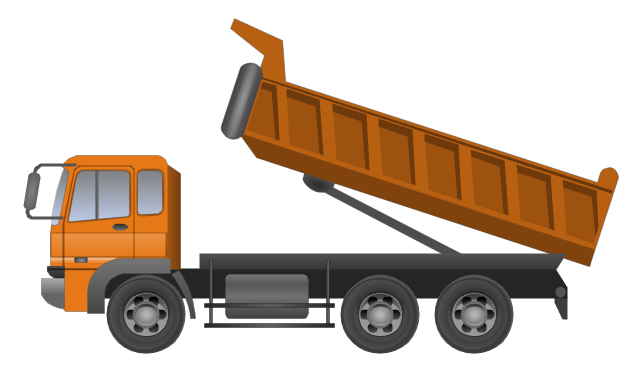
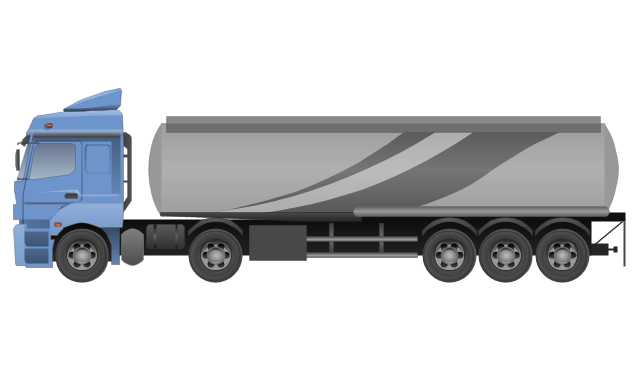
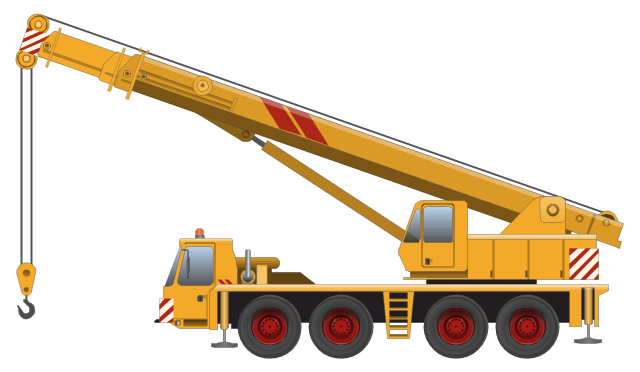
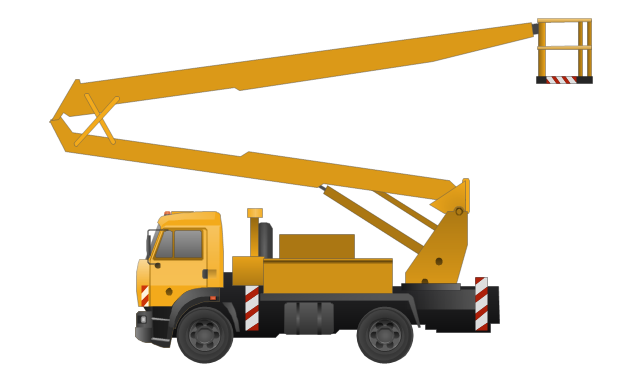
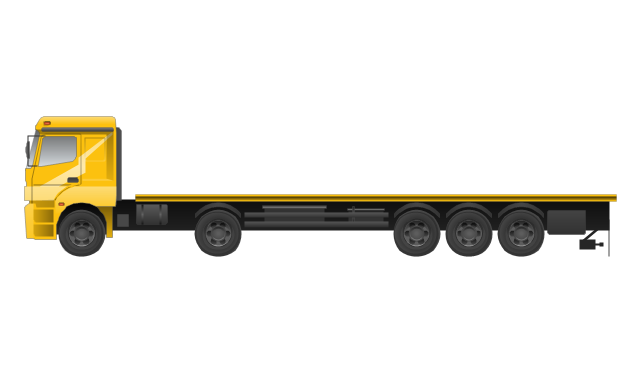
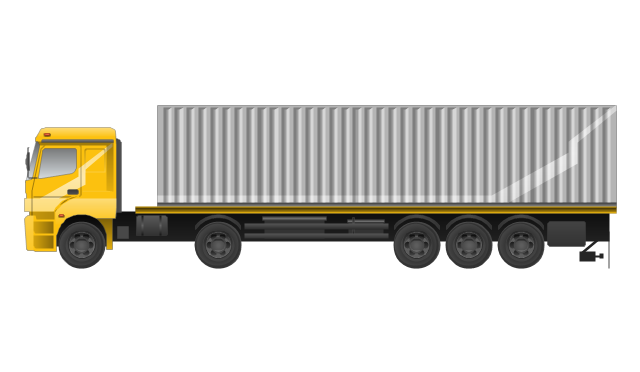
The vector stencils library "Industrial vehicles" contains 14 clipart images of industrial and building vehicles for drawing illustrations.
"A truck (US, CA, AU, NZ) or lorry (UK and Ireland) is a motor vehicle designed to transport cargo. Trucks vary greatly in size, power, and configuration, with the smallest being mechanically similar to an automobile. Commercial trucks can be very large and powerful, and may be configured to mount specialized equipment, such as in the case of fire trucks and concrete mixers and suction excavators. Modern trucks are largely powered by diesel engines exclusively, although small to medium size trucks with gasoline engines exist in America. In the European Union vehicles with a gross combination mass of less than 3,500 kilograms (7,716 lb) are known as light commercial vehicles and those over as large goods vehicles." [Truck. Wikipedia]
The clip art example "Industrial vehicles - Vector stencils library" was created in the ConceptDraw PRO diagramming and vector drawing software using the Manufacturing and Maintenance solution from the Illustration area of ConceptDraw Solution Park.
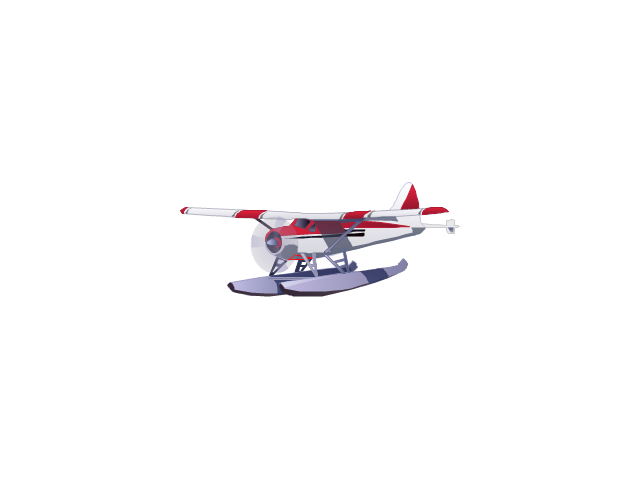
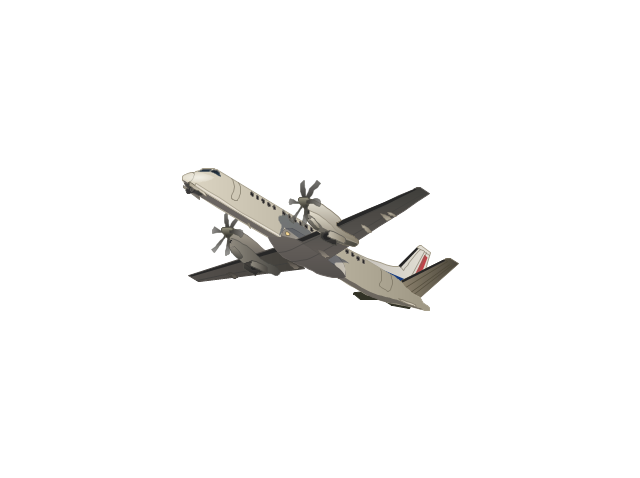
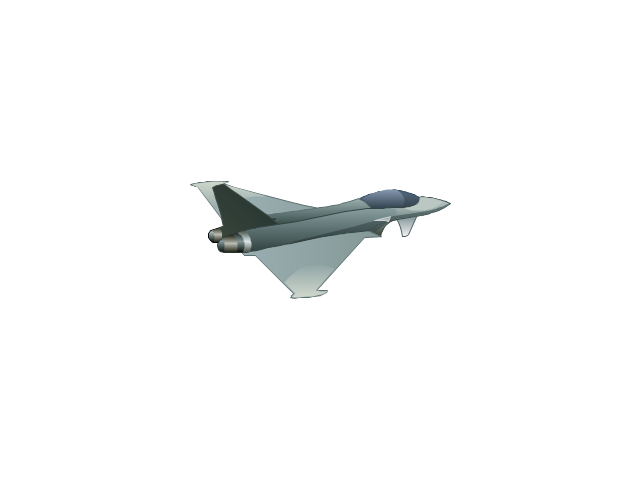
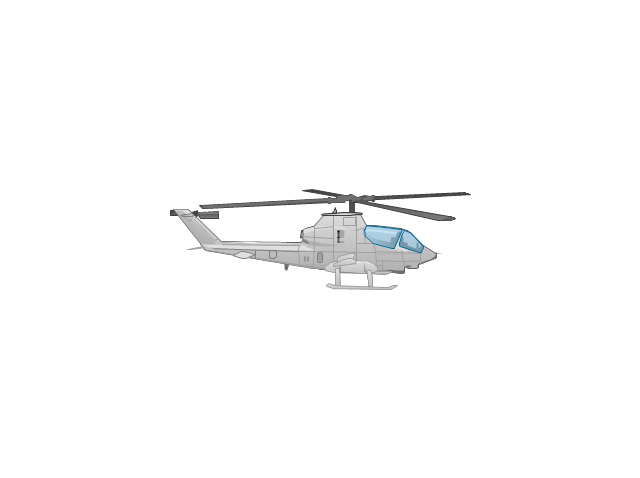
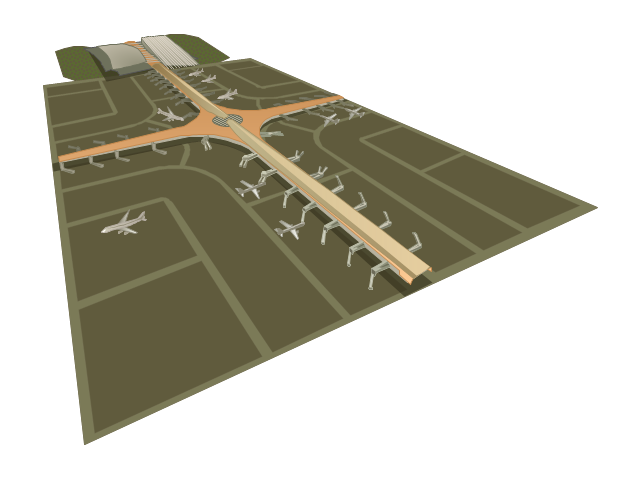
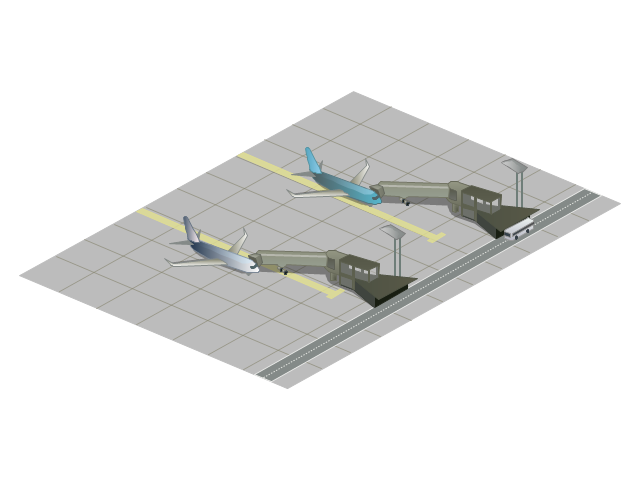
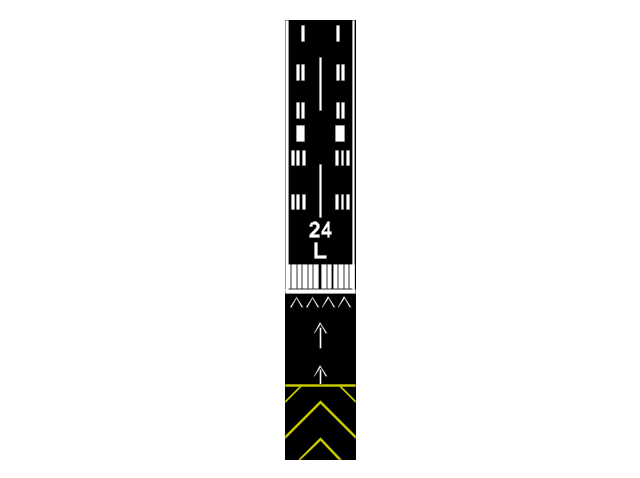
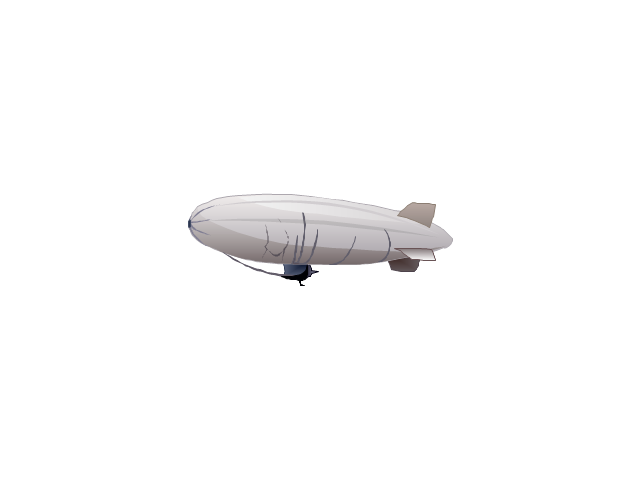
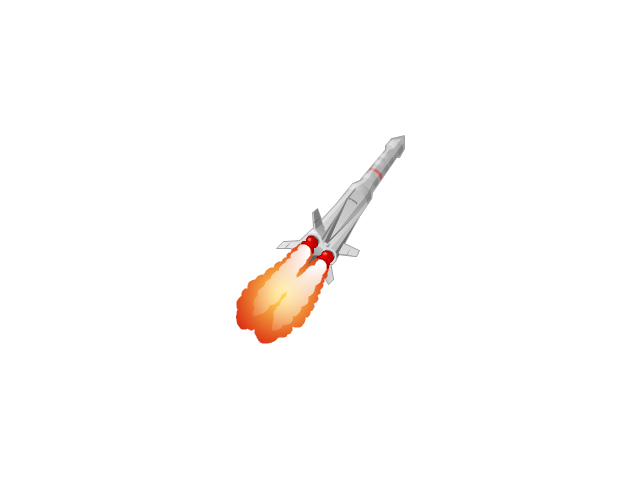
The vector stencils library "Aircraft" contains 19 clip art images for creating aviation illustrations, presentation slides, infographics and webpages using the ConceptDraw PRO diagramming and vector drawing software.
"An aircraft is a machine that is able to fly by gaining support from the air, or, in general, the atmosphere of a planet. It counters the force of gravity by using either static lift or by using the dynamic lift of an airfoil, or in a few cases the downward thrust from jet engines.
The human activity that surrounds aircraft is called aviation. Crewed aircraft are flown by an onboard pilot, but unmanned aerial vehicles may be remotely controlled or self-controlled by onboard computers. Aircraft may be classified by different criteria, such as lift type, propulsion, usage and others." [Aircraft. Wikipedia]
The vector stencils library "Aircraft" is included in the Aerospace and Transport solution from the Illustrations area of ConceptDraw Solution Park.
www.conceptdraw.com/ solution-park/ illustrations-aerospace-transport
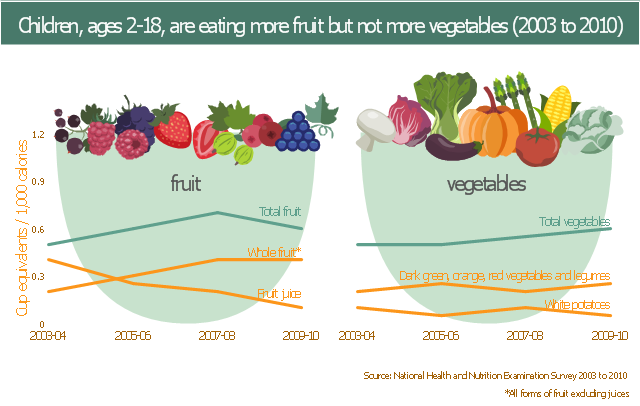
This human nutrition infogram example was redesigned from the figure from the web page "Progress on Children Eating More Fruit, Not Vegetables" from the U.S. Centers for Disease Control and Prevention (CDC) website.
[cdc.gov/ vitalsigns/ fruit-vegetables/ ]
"Fruits are generally high in fiber, water, vitamin C and sugars, although this latter varies widely from traces as in lime, to 61% of the fresh weight of the date. Fruits also contain various phytochemicals that do not yet have an RDA/ RDI listing under most nutritional factsheets, and which research indicates are required for proper long-term cellular health and disease prevention. Regular consumption of fruit is associated with reduced risks of cancer, cardiovascular disease (especially coronary heart disease), stroke, Alzheimer disease, cataracts, and some of the functional declines associated with aging.
Diets that include a sufficient amount of potassium from fruits and vegetables also help reduce the chance of developing kidney stones and may help reduce the effects of bone-loss. Fruits are also low in calories which would help lower one's calorie intake as part of a weight-loss diet." [en.wikipedia.org/ wiki/ Fruit]
"Vegetables play an important role in human nutrition. Most are low in fat and calories but are bulky and filling. They supply dietary fibre and are important sources of essential vitamins, minerals and trace elements. Particularly important are the antioxidant vitamins A, C and E. When vegetables are included in the diet, there is found to be a reduction in the incidence of cancer, stroke, cardiovascular disease and other chronic ailments. Research has shown that, compared with individuals who eat less than three servings of fruits and vegetables each day, those that eat more than five servings have an approximately twenty percent lower risk of developing coronary heart disease or stroke." [en.wikipedia.org/ wiki/ Vegetable]
The example "Fruit and vegetables consumption infogram" was designed using the ConceptDraw PRO diagramming and vector drawing software extended with the Food Court solution from the Food and Beverages area of ConceptDraw Solution Park.
The vector stencils library "Media" contains 42 digital media icons.
Use it to design your audio, video and multimedia illustrations, presentations, web pages and infographics with ConceptDraw PRO diagramming and vector drawing software.
The vector stencils library "Media" is included in the Audio, Video, Media solution from the Illustration area of ConceptDraw Solution Park.
- Door Plant Top View Png
- Stomach Vector Png
- Speedometer Png
- Ecosystem goods and services - Segmented pyramid diagram ...
- 4 Level pyramid model diagram - Information systems types | 5 Level ...
- Flow chart Example. Warehouse Flowchart | Pyramid Chart ...
- 3D Column chart - Iran internet users per 100 person | Column Chart ...
- 4 Level pyramid model diagram - Information systems types ...
- Apparatus for testing the strength of a hydraulic hose splice ...
- Think and act effectively | Percent of students achieved a 36 on ACT ...
- Competitive strategy matrix
- Service-goods continuum diagram | Ecosystem goods and services ...
- Nitrate concentration in Community Water Systems (CWS) - Double ...
- Order processing - Cross-functional flowchart | Order processing ...
- Human Resource Development | Organizational Structure Types ...
- Bar Chart Examples | Sales Growth. Bar Graphs Example | Financial ...
- Organization Development vs. Business Process Reengineering ...
- Basic Flowchart Symbols and Meaning | Audit Flowchart Symbols ...
- Road signs - Vector stencils library
- Food infogram - Reducing sodium | Fast food restaurant menu ...
