HelpDesk
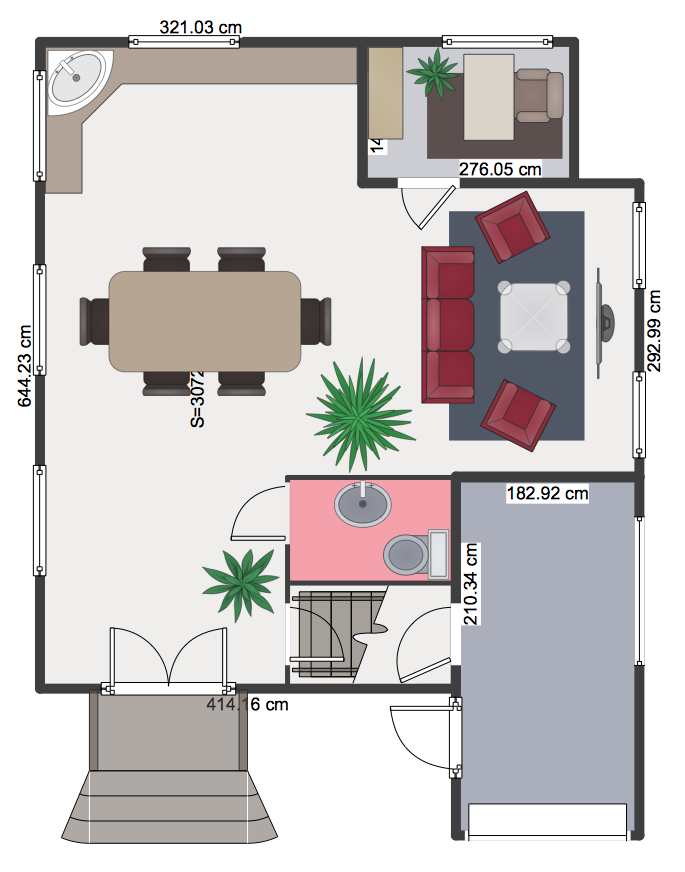
How to Create a Floor Plan Using ConceptDraw PRO
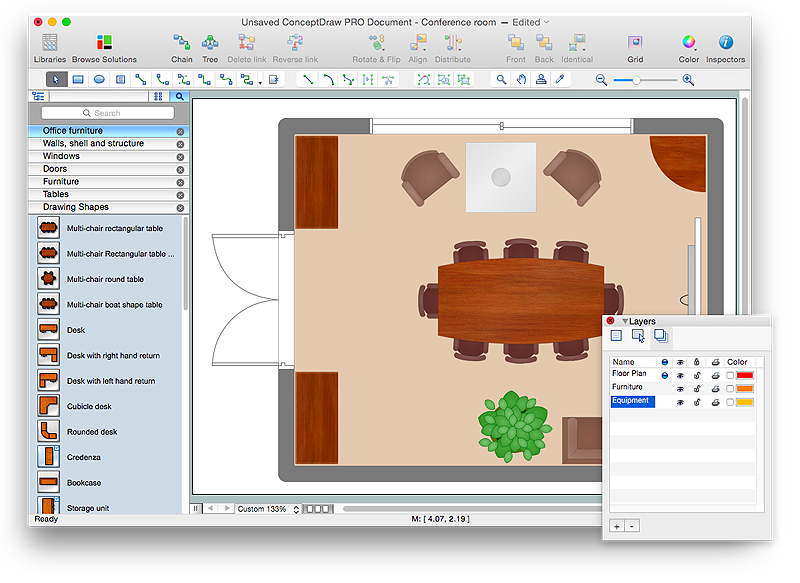
Making a floor plan is the best way to get a handle on how to organize your living space, and find out what could be changed. Creating a floor plan to scale is a challenge of the home and interior design process and can be noticeably helpful for visualizing things like furniture layout. You can use ConceptDraw PRO to produce layouts of real estate properties. ConceptDraw PRO contains the large quantity of pre-designed vector objects that you can use for quick and easy designing such floor plans. You can easily determine the size of the rooms and distances in you drawing. The ability to create a floor plan is delivered by the Floor Plans solution. This solution extends ConceptDraw PRO with libraries that contains over 500 objects of floor plan elements. There is a set of special objects that displays the sizes, corners, squares and other technical details using the current measurements of units.The vector stencils library "Map symbols" contains 19 symbols for labeling the maps.
The pictograms example "Map symbols - Vector stencils library" was created using the ConceptDraw PRO diagramming and vector drawing software extended with the Directional Maps solution from the Maps area of ConceptDraw Solution Park.
The pictograms example "Map symbols - Vector stencils library" was created using the ConceptDraw PRO diagramming and vector drawing software extended with the Directional Maps solution from the Maps area of ConceptDraw Solution Park.
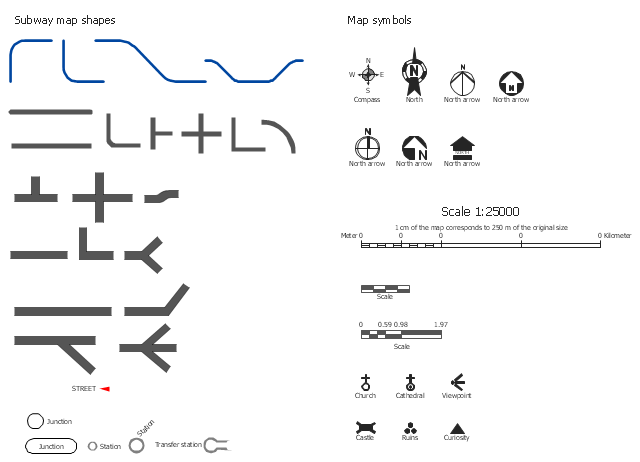
The vector stencils library "Map symbols" contains 19 symbols for labeling the maps.
The pictograms example "Map symbols - Vector stencils library" was created using the ConceptDraw PRO diagramming and vector drawing software extended with the Directional Maps solution from the Maps area of ConceptDraw Solution Park.
The pictograms example "Map symbols - Vector stencils library" was created using the ConceptDraw PRO diagramming and vector drawing software extended with the Directional Maps solution from the Maps area of ConceptDraw Solution Park.
The vector stencils library Map symbols contains 19 icons for labeling the maps using the ConceptDraw PRO diagramming and vector drawing software.
The vector stencils library Subway map contains 41 shapes for creating the subway (tube, metro) maps using the ConceptDraw PRO.
"The various features shown on a map are represented by conventional signs or symbols. For example, colors can be used to indicate a classification of roads. Those signs are usually explained in the margin of the map, or on a separately published characteristic sheet.
Some cartographers prefer to make the map cover practically the entire screen or sheet of paper, leaving no room "outside" the map for information about the map as a whole. These cartographers typically place such information in an otherwise "blank" region "inside" the map -- cartouche, map legend, title, compass rose, bar scale, etc. In particular, some maps contain smaller "sub-maps" in otherwise blank regions—often one at a much smaller scale showing the whole globe and where the whole map fits on that globe, and a few showing "regions of interest" at a larger scale in order to show details that wouldn't otherwise fit." [Map. Wikipedia]
The example "Design elements - Subway map, Map symbols" is included in the Directional Maps solution from the Maps area of ConceptDraw Solution Park.
HelpDesk
How to Resize Objects in ConceptDraw PRO
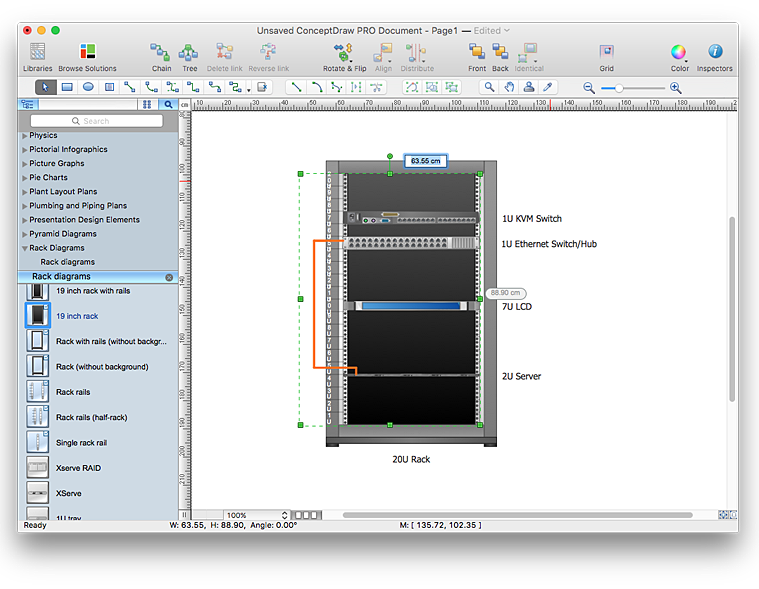
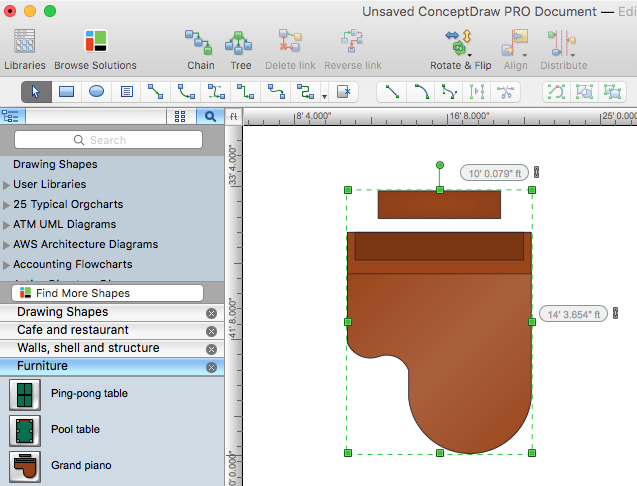
When creating diagram using ConceptDraw PRO, you can select, move, resize and rotate objects. After selecting an object (or objects) in a document, you can change it position, resize it or move an object to the desired position. The sizes of objects in ConceptDraw PRO can be changed by simple dragging, or you can set a particular size of any object. Using ConceptDraw PRO, you can re-size an object on the page using the absolute measurements instead of a mouse. You can make quick work of designing complex drawing using a combination of different-sized items.HelpDesk
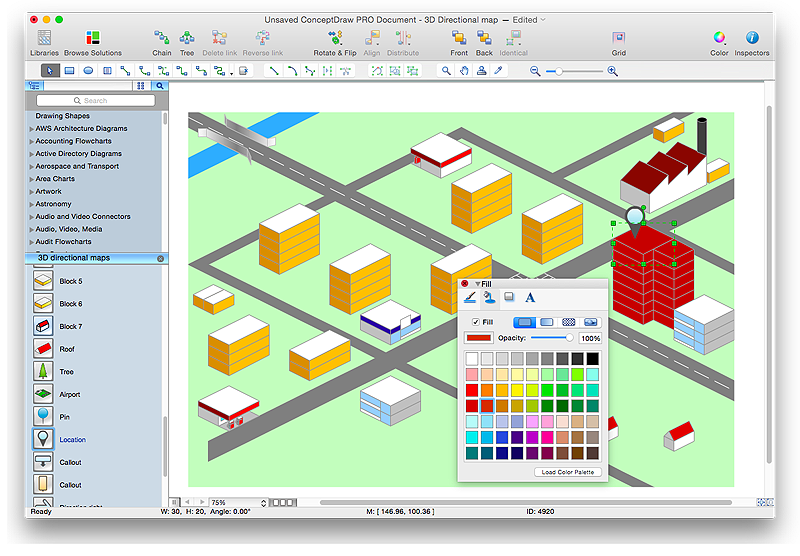
How to Create a Directional Map Using ConceptDraw PRO
Travelers often use directional maps to find directions for certain places. These maps are guide millions of tourists to explore towns and cities worldwide. Searching addresses on a map, view nearby businesses, get driving directions - this is only a little of what directional maps is needed. ConceptDraw PRO allows you to create various kinds of directional maps. You can easily visualize city maps or destinations with driving directions and traveler information using special vector stencils libraries.HelpDesk
How to Change Measurement Units in ConceptDraw Drawing
ConceptDraw PRO allows you to work with drawings with many different measurement units.HelpDesk
How to Draw a Floor Plan for Your Office
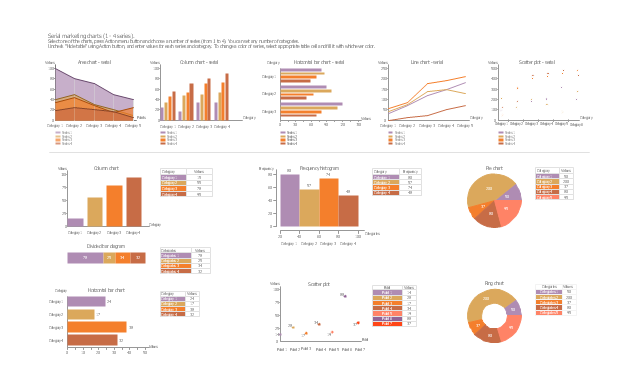
Designing the right office space is is an essential factor of business productivity. An office floor plan should reflect the needs of both employees and customers. ConceptDraw PRO allows you to draw the Floor Plan for your office using a special office equipment library as well as set of special objects that displays the sizes, corners, squares and other floor plan details.The vector stencils library "Marketing charts" contains 12 graphs and charts: area chart, column chart, divided bar diagram, histogram, horizontal bar graph, line graph, pie chart, ring chart, scatter plot.
Use it to create your marketing infograms.
"A chart can take a large variety of forms, however there are common features that provide the chart with its ability to extract meaning from data.
Typically the data in a chart is represented graphically, since humans are generally able to infer meaning from pictures quicker than from text. Text is generally used only to annotate the data.
One of the more important uses of text in a graph is the title. A graph's title usually appears above the main graphic and provides a succinct description of what the data in the graph refers to.
Dimensions in the data are often displayed on axes. If a horizontal and a vertical axis are used, they are usually referred to as the x-axis and y-axis respectively. Each axis will have a scale, denoted by periodic graduations and usually accompanied by numerical or categorical indications. Each axis will typically also have a label displayed outside or beside it, briefly describing the dimension represented. If the scale is numerical, the label will often be suffixed with the unit of that scale in parentheses. ...
The data of a chart can appear in all manner of formats, and may include individual textual labels describing the datum associated with the indicated position in the chart. The data may appear as dots or shapes, connected or unconnected, and in any combination of colors and patterns. Inferences or points of interest can be overlaid directly on the graph to further aid information extraction.
When the data appearing in a chart contains multiple variables, the chart may include a legend (also known as a key). A legend contains a list of the variables appearing in the chart and an example of their appearance. This information allows the data from each variable to be identified in the chart." [Chart. Wikipedia]
The shapes example "Design elements - Marketing charts" was created using the ConceptDraw PRO diagramming and vector drawing software extended with the Marketing Infographics solition from the area "Business Infographics" in ConceptDraw Solution Park.
The vector stencils library "AWS Database" contains 30 Amazon Web Services database icons: Amazon DynamoDB icons, Amazon ElastiCache icons, Amazon Relational Database Service icons, Amazon Redshift icons, AWS Database Migration Service icons.
Use it to draw Amazon Web Services architecture diagrams with ConceptDraw PRO diagramming and vector drawing software.
"Amazon DynamoDB is a fast and flexible NoSQL database service... It is a fully managed cloud database and supports both document and key-value store models." [aws.amazon.com/ dynamodb/ ]
"ElastiCache is a web service that makes it easy to deploy, operate, and scale an in-memory cache in the cloud." [aws.amazon.com/ elasticache/ ]
"Amazon Relational Database Service (Amazon RDS) makes it easy to set up, operate, and scale a relational database in the cloud. ... Amazon RDS provides you six familiar database engines to choose from, including Amazon Aurora, Oracle, Microsoft SQL Server, PostgreSQL, MySQL and MariaDB." [aws.amazon.com/ rds/ ]
"Amazon Redshift is a fast, fully managed, petabyte-scale data warehouse that makes it simple and cost-effective to analyze all your data using your existing business intelligence tools." [aws.amazon.com/ redshift/ ]
"AWS Database Migration Service helps you migrate databases to AWS easily and securely." [aws.amazon.com/ dms/ ]
The AWS icons example "Design elements - AWS Database" is included in the AWS Architecture Diagrams solution from the Computer and Networks area of ConceptDraw Solution Park.
HelpDesk
How to Draw an Emergency Plan for Your Office
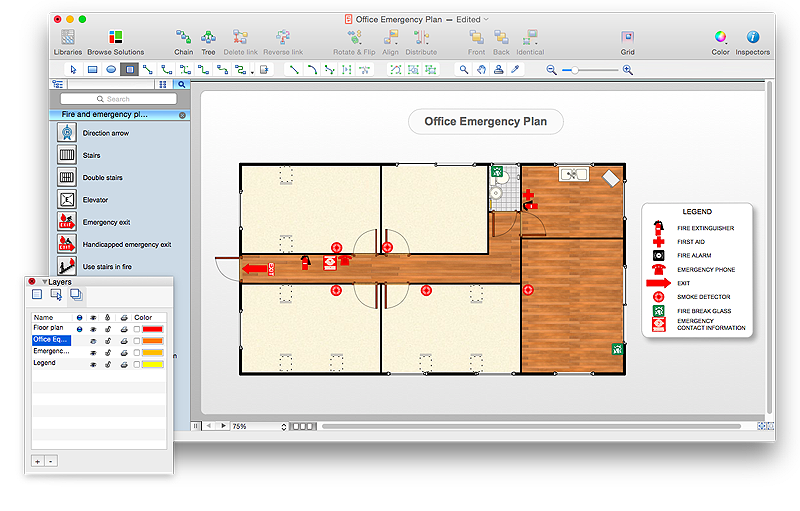
Emergency Floor Plan is important to supply an office staff with a visual safety solution. Emergency Floor Plan diagram presents a set of standard symbols used to depict fire safety, emergency, and associated information. Using clear and standard symbols on fire emergency plans delivers the coherence of collective actions , helps to avoid embarrassment, and improves communications in an emergent situation. The fire emergency symbols are intended for the general emergency and fire service, as well as for building plans ,engineering drawings and insurance diagrams. They can be used during fire extinguishing and evacuation operations, as well as training. It includes vector symbols for emergency management mapping, emergency evacuation diagrams and plans. You can use ConceptDraw PRO to make the fire evacuation plans for your office simple, accurate and easy-to-read.
The vector stencils library "AWS Application Services" contains 7 AWS application services icons: Amazon API Gateway icon, Amazon AppStream icon, Amazon Elastic Transcoder icons, Amazon SWF icons, AWS Step Functions icon.
Use it to draw Amazon Web Services architecture diagrams with ConceptDraw PRO diagramming and vector drawing software.
"Amazon API Gateway is a fully managed service that makes it easy for developers to create, publish, maintain, monitor, and secure APIs at any scale." [aws.amazon.com/ api-gateway/ ]
"Amazon AppStream enables you to stream your existing Windows applications from the cloud, reaching more users on more devices, without code modifications." [aws.amazon.com/ appstream/ ]
"Amazon CloudSearch is a managed service in the AWS Cloud that makes it simple and cost-effective to set up, manage, and scale a search solution for your website or application." [aws.amazon.com/ cloudsearch/ ]
"Amazon Elastic Transcoder is media transcoding in the cloud." [aws.amazon.com/ elastictranscoder/ ]
"Amazon Simple Email Service (Amazon SES) is a cost-effective email service built on the reliable and scalable infrastructure that Amazon.com developed to serve its own customer base." [aws.amazon.com/ ses/ ]
"Amazon Simple Queue Service (SQS) is a fast, reliable, scalable, fully managed message queuing service." [aws.amazon.com/ sqs/ ]
"Amazon Simple Workflow Service (SWF) ... helps developers build, run, and scale background jobs that have parallel or sequential steps." [aws.amazon.com/ swf/ ]
The AWS icons example "Design elements - AWS Application Services" is included in the AWS Architecture Diagrams solution from the Computer and Networks area of ConceptDraw Solution Park.
The vector stencils library "AWS Migration" contains 6 Amazon Web Services migration icons: AWS Application Discovery Service, AWS DMS, AWS SMS, AWS Snowball, Database migration workflow/ job, Import/ Export.
Use it to draw AWS architecture diagrams with ConceptDraw PRO software.
Amazon Migration services includes: "AWS Application Discovery Service (Discover On-Premises Applications to Streamline Migration), AWS Database Migration Service (Migrate Databases with Minimal Downtime), AWS Server Migration Service (Migrate On-Premises Servers to AWS), AWS Snowball (Petabyte-scale Data Transport), AWS Snowball Edge (Petabyte-scale Data Transport with On-board Compute), AWS Snowmobile (Exabyte-scale Data Transport)" [aws.amazon.com]
The AWS icons example "Design elements - AWS Migration" is included in the AWS Architecture Diagrams solution from the Computer and Networks area of ConceptDraw Solution Park.
- Draw To Scale Office Layout
- Graph Scale Maker
- How to Create a Floor Plan Using ConceptDraw PRO | Create Floor ...
- Nba Basketball Court Scale
- Map Scale Bar Clipart 50 Scale
- Architecture Scale Symbols
- Sport Field Plans | Volleyball Court Scale
- Volleyball Ground Scale Map
- Sport Field Plans | Volleyball Ground Scale
- Time Scale Diagram
- Graph Scale Generator
- Sport Field Plans | Scale Diagram Of A Volleyball Court
- Volly Ball Ground Scale
- Scale Symbol Meaning
- How To Draw Time Scale Diagram
- Field Scale Of Basketball Ground
- Map Symbols Scale Bar
- Change Scale In Conceptdraw
- Scale
- Symbol Ruler Clock Scale
