Flowchart design. Flowchart symbols, shapes, stencils and icons
A flowchart is a type of diagram which represents an algorithm, process or workflow, displays the steps as boxes of various kinds and depicts their order by connecting them with arrows. Any business graphic document will be more colorful and understandable if will use professional-looking and visual diagrams and flowcharts. Flowchart design gives versatile presenting and explaining of the process. ConceptDraw PRO flowchart software enhanced with Flowcharts solution helps effectively make Flowchart Design. Use of predesigned flowchart symbols and bright color palette offers a fresh view and favorably distinguishes the flowcharts designed in ConceptDraw PRO from the black and white flowcharts on a paper. Preferably to use no more than three or four colors and apply identical for the same shape types. The best flowchart design can be achieved by starting with Flowchart template, or any of suitable ready examples or samples offered in ConceptDraw STORE, open one of them and enter the proper text into each Flowchart shape. Each symbol of the flowchart has a definition that can't be changed. This means that all flowcharts shapes can be grouped in according to their meaning. Users with ConceptDraw PRO flowchart software can style groups of symbols with close definitions by color sets chosen from complementary palette. Almost all workflows can be depicted as a flowchart. Colored diagrams are more light for perception of the certain information, this is part of flowchart design. Bright colors need to be used in the key points of Decision symbols, to focus attention on their importance for whole process flow.
Cross-Functional Flowchart
Use of Cross-Functional Flowchart is a clear way of showing each team member’s responsibilities and how processes get shared or transferred between different responsible people, teams and departments. Use the best flowchart maker ConceptDraw PRO with a range of standardized cross-functional flowchart symbols to create the Cross-Functional Flowcharts simply and to visualize the relationship between a business process and the functional units responsible for that process. To draw the most quickly Cross-Functional Flowcharts, Cross Functional Process Maps, or Cross Functional Process Flow Diagrams, start with a Cross-functional flowchart samples and templates from ConceptDraw Solution Park. The ConceptDraw Arrows10 and RapidDraw technologies will be also useful for you in drawing. ConceptDraw PRO supports designing both types - horizontal and vertical Cross-functional flowcharts. A vertical layout makes the accents mainly on the functional units while a horizontal layout - on the process. If you need a Visio alternative in Mac OS X, try ConceptDraw PRO. Its interface is very intuitive and it’s actually much easier to use than Visio, yet somehow it’s just as powerful if not more so. ConceptDraw PRO performs professional quality work and seamless Visio interaction.
Visio Files and ConceptDraw
Visio Files and ConceptDraw. ConceptDraw PRO is compatible with MS Visio .VDX formatted files.VDX is Visio’s open XML file format, and it can be easily imported and exported by ConceptDraw PRO.Basic Diagramming
Create flowcharts, organizational charts, bar charts, line graphs, and more with ConceptDraw PRO.
HelpDesk
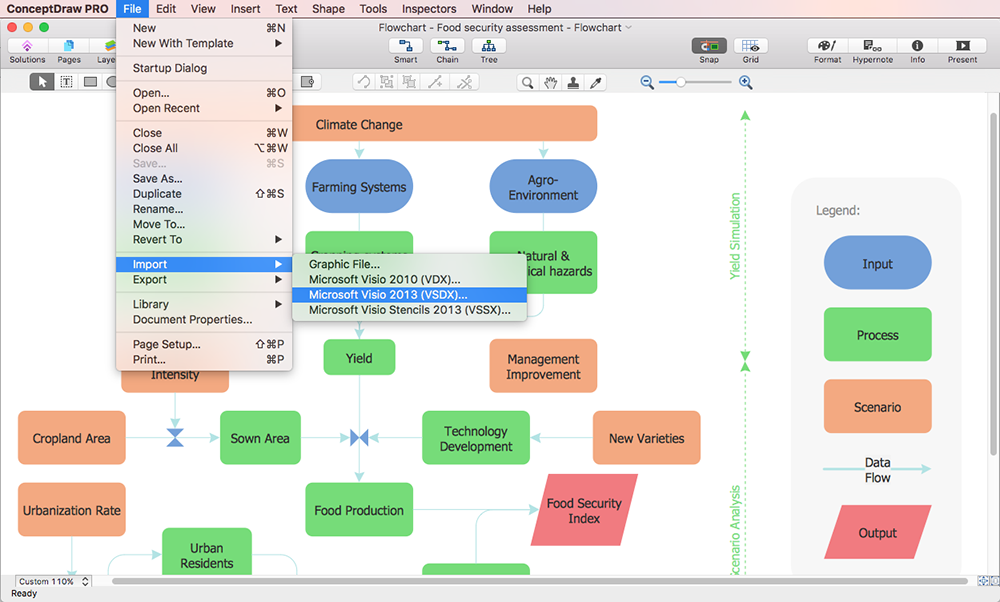
How to Open MS Visio® 2013/2016 Files on a Mac®
Powerful business graphics and diagramming tools are the norm and not the exception for today’s businesses. For years the de facto standard file format for business has been Microsoft Visio™. Many people involved in visual communication need software tools that will read and write using the Visio file format. With the introduction of Visio 2013 Microsoft has changed the native file format used in earlier versions of Microsoft Visio. ConceptDraw PRO v10 file import and export works round-trip with the new Visio VSDX file format.MS Visio Look a Like Diagrams
No need for any special drawing skills to create professional looking diagrams outside of your knowledge base. ConceptDraw PRO takes care of the technical details, allowing you to focus on your job, not the drawing. ConceptDraw PRO delivers full-functioned alternative to MS Visio. ConceptDraw PRO supports import of Visio files. ConceptDraw PRO supports flowcharting, swimlane, orgchart, project chart, mind map, decision tree, cause and effect, charts and graphs, and many other diagram types.How to Make SWOT Analysis in a Word Document
A SWOT Analysis is a popular tool of the strategic planning which is used to evaluate the Strengths, Weaknesses, Opportunities, and Threats that are involved in any businesses. Use of mind maps allows you to collect a lot of information used for SWOT Analysis, visually structure it and also identify the relationships between different parts of this information. SWOT and TOWS Matrix Diagrams solution for ConceptDraw Solution Park combines professional visual advantages of ConceptDraw MINDMAP software and presentation capabilities of ConceptDraw PRO, which together provide a complete work solution. The SWOT and TOWS diagrams, matrices or mind maps produced in ConceptDraw PRO using the predesigned vector objects or filling the ready templates, can be then easily exported to Microsoft Word, Microsoft Visio, Microsoft PowerPoint, Adobe PDF, and many other electronic file formats. The possibility of export makes easy the use of SWOT diagrams designed in ConceptDraw PRO and lets you efficiently collaborate even with people who maybe don't have this software.Geo Map - Canada - Newfoundland and Labrador
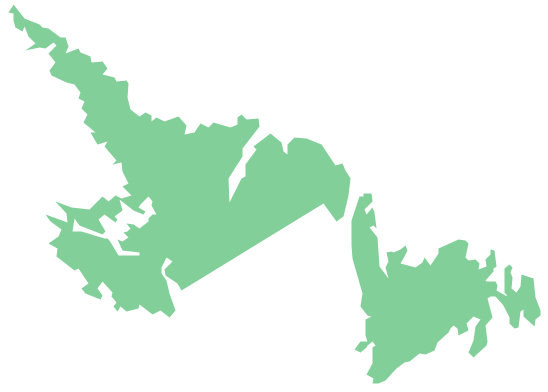
Newfoundland and Labrador is the easternmost province of Canada. The vector stencils library Newfoundland and Labrador contains contours for ConceptDraw PRO diagramming and vector drawing software. This library is contained in the Continent Maps solution from Maps area of ConceptDraw Solution Park.Geo Map - Europe - Croatia
The vector stencils library Croatia contains contours for ConceptDraw PRO diagramming and vector drawing software. This library is contained in the Continent Maps solution from Maps area of ConceptDraw Solution Park.Geo Map — USA — Virginia
Virginia, officially the Commonwealth of Virginia, is a U.S. state located in the South Atlantic region of the United States. The vector stencils library Virginia contains contours for ConceptDraw PRO diagramming and vector drawing software. This library is contained in the Continent Maps solution from Maps area of ConceptDraw Solution Park.Geo Map - Europe - Lithuania
The vector stencils library Lithuania contains contours for ConceptDraw PRO diagramming and vector drawing software. This library is contained in the Continent Maps solution from Maps area of ConceptDraw Solution Park.Geo Map - Africa
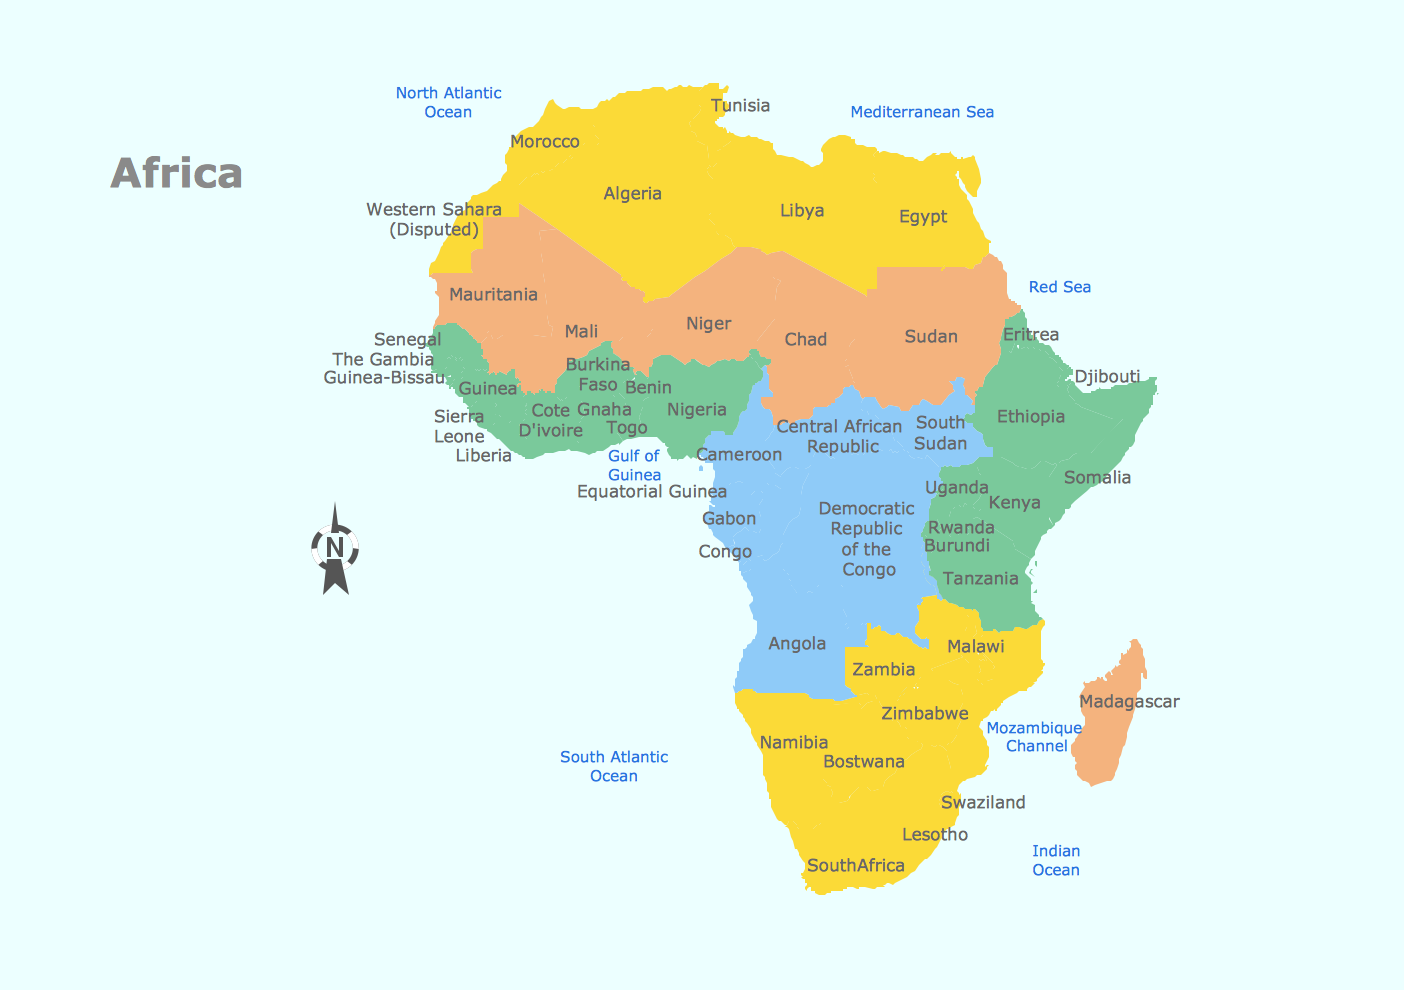
Africa has 54 fully recognized sovereign states, 9 territories and two de facto independent states with limited or no recognition. Vector design elements library Africa contains country map contours, geographical maps, cartograms and thematic maps for ConceptDraw PRO diagramming and vector drawing software. To help visualize the business and thematic information connected with geographic areas, locations or customs. All ConceptDraw PRO documents are vector graphic files and are available for reviewing, modifying, and converting to a variety of formats: image, HTML, PDF file, MS PowerPoint Presentation, Adobe Flash, MS Visio (.VDX, .VSDX).- Software Deployment Diagram Visio
- Flowchart Software | In searching of alternative to MS Visio for MAC ...
- Line Graph Charting Software | Line Chart Template for Word | Chart ...
- How to Open MS Visio® 2013 /2016 Files on a Mac® Using ...
- Flowchart Software | Visio Exchange | IDEF0 Visio | Visio For Free ...
- Entity Relationship Diagram Symbols and Meaning ERD Symbols ...
- Contoh Flowchart | How To Create a MS Visio Flowchart Using ...
- In searching of alternative to MS Visio for MAC and PC with ...
- Flowchart Software | Active Directory Diagram | Network Diagram ...
- Flowchart Software | How To Create a MS Visio Cross-Functional ...
- Software Flowchart Visio Import
- How to Open MS Visio® 2013 /2016 Files on a Mac® Using ...
- How to Open MS Visio® 2013 /2016 Files on a Mac® Using ...
- How to Open MS Visio® 2013 /2016 Files on a Mac® Using ...
- Basic Flowchart Symbols and Meaning | How To Create a MS Visio ...
- Flowchart Software | Stakeholder Onion Diagram Template | Venn ...
- How to Open MS Visio® 2013 /2016 Files on a Mac® Using ...
- Cross Functional Flowchart Visio Examples
- Comparison Dashboard | Feature Comparison Chart Software ...


